The Morning Report: Buyers Struggling At Key Price Resistance Levels
January 27 S&P 500 futures buyers and sellers are currently battling near a support region around 1883. Buyers appear likely to win but sellers are trying to force to breakdown back below 1883.
Look for higher lows to continue on S&P 500 futures IF we can breach and hold 1887. Longer time frame resistance levels are sitting now at 1894.5, 1899, 1904.75, and 1915.
Intraday resistance for january 27 S&P 500 futures sits near 1894.5. Intraday support sits at 1873 (congestion sits at 1883 and 1886– watch these midlines – they will gives clues to moves ahead). Deeper pullbacks on stock market futures will continue to be bought, and expansions upward will be sold until we see higher lows to continue and the lower highs broken to the upside. Jagged trading continues for S&P 500 futures.
It would be troubling for buyers to see lower highs continue.
Shorter time frame momentum indicators are lifting but sitting in neutral territory. Longer cycles are downward trending but lifting –still firmly in negative territory- this means larger upside resistance tests should be sold.
See today’s economic calendar with a rundown of releases.
THE RANGE OF TUESDAY’S MOTION
Crude Oil Futures (CL_F)
The API report showed crude oil supplies climbed 11.4 million barrels, yet crude oil futures seem to be developing a clear line of support near 30. Momentum is shifting beneath to show more bullish activity but again, this should only be into resistance. The trouble with this formation is that if it fails the level, buyers will be too exhausted to recapture the region. So I’ll be watching that area carefully.
Trading ranges are between 30.1 and 31.35, with 30.6 being an important support level to hold on any retrace.
Moving averages on crude oil futures are still clearly negative on longer time frames but holding bounces from that last large drift downward. This will give buyers confidence in moving forward. The line in the sand is 32.8. A breach and hold above that level should bring a big group of players to the table.
Intraday long trade setup suggests a long off 30.6 or 30.23 (with momentum showing positive, else that brings a lower high) into 30.85, 31.03, 31.35, 31.85, 32.12, 32.35, 32.6, 32.7 and 33.2 but charts get very muddy in those regions above– see the blog for levels above that region.
Intraday short trade setup suggests a short below a 30.45 failed retest or a failed retest of 31.59 with negative divergence showing sends us to 31.22, 31.04, 30.65, 30.29, 30, 29.89, 29.65, 29.48, 29.36, and 28.77 if we lose traction again. Momentum on longer time frames remains sloping negative but somewhat divergent as we move north.
E-mini S&P 500 Futures (ES_F)
Below is a S&P 500 futures chart with price support and resistance trading levels for today. Click to enlarge.
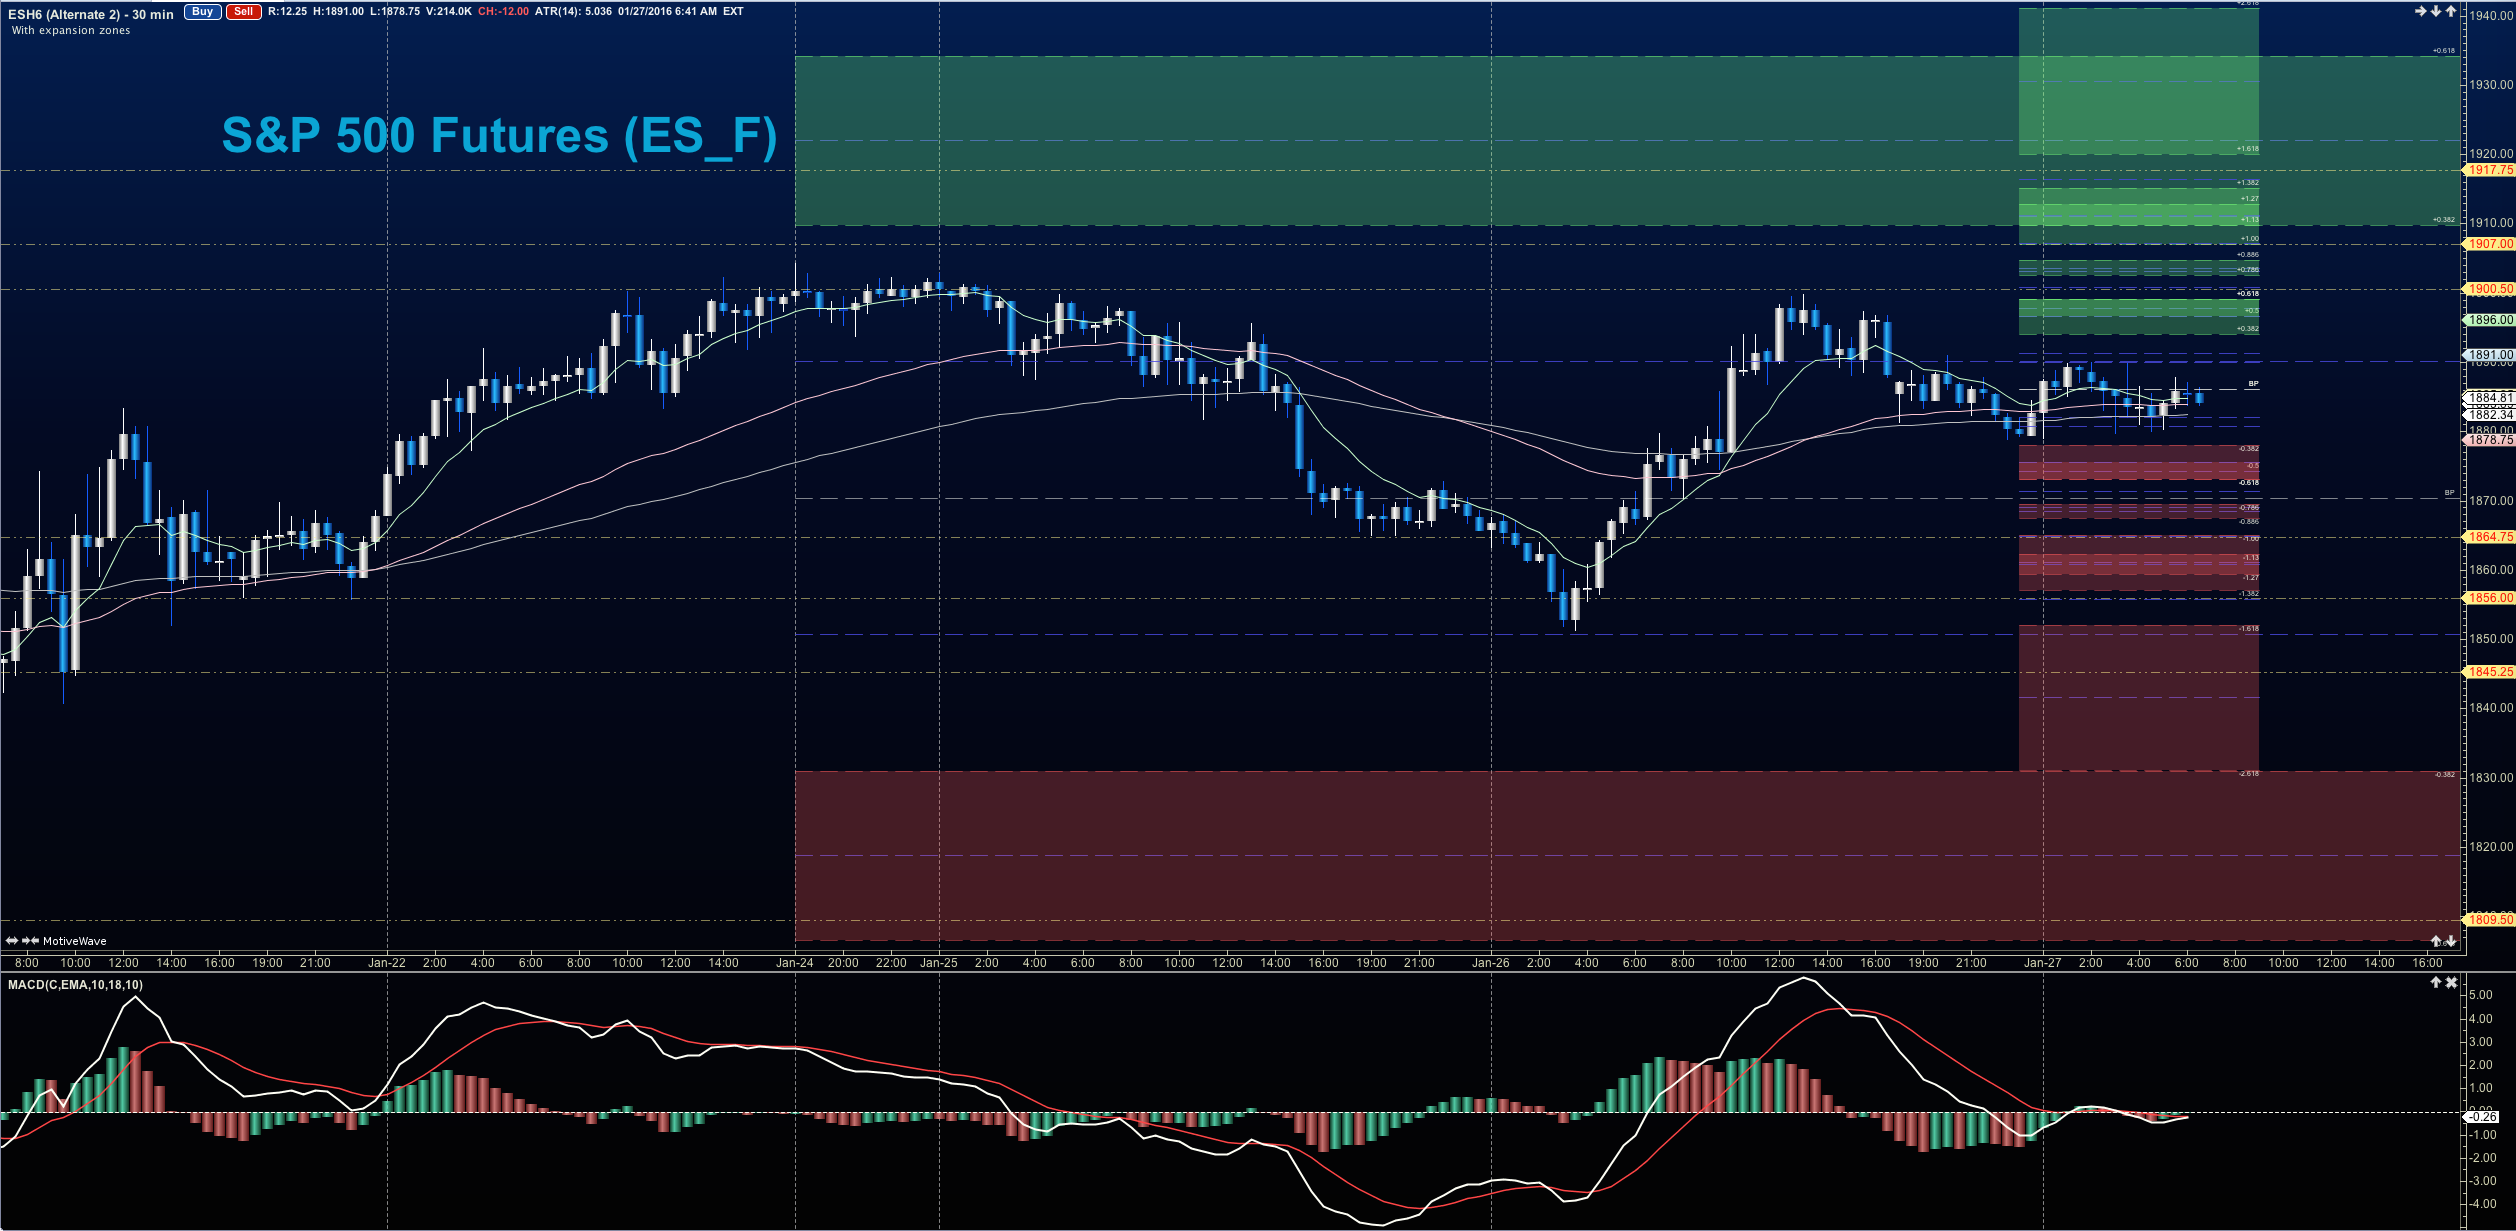
The chart above is for today January 27 S&P 500 futures trading. It is holding steady near price support levels – currently testing 1883. A region of importance is near 1887-1889, and as long as we lie below these areas, we remain vulnerable to selling action.
Upside motion has the best setup on the breach of and positive retest of 1887.5 – or a bounce off 1875, but if we come back there, watch for a potential lower high setting in intraday. Targets from 1875 are 1878.5, 1883, 1886.5, 1889.25, 1892, 1894.5, 1899, and 1902.25. A big resistance test sits at the region between 1890–1894.75. The chart could expand under positive strength into 1902.25 and higher if momentum lifts. Be careful- watch the higher lows to keep you on the right side of the trade.
Downside motion opens below any failed retest of 1873.5 or at the failure to hold 1894 after a bounce – but that pullback would likely be into higher support. Any S&P 500 futures retracement into deeper support levels from 1873.5 gives us targets at 1871.5, 1868.5, 1865, 1861.25, 1857.75, and perhaps 1847.75.
If you’re interested in the live trading room, it is now primarily stock market futures content, though we do track heavily traded stocks and their likely daily trajectories as well – we begin at 9am with a morning report and likely chart movements along with trade setups for the day.
As long as the trader remains aware of support and resistance levels, risk can be very adequately managed to play in either direction as bottom picking remains a behavior pattern that is developing with value buyers and speculative traders.
Twitter: @AnneMarieTrades
The author trades stock market futures every day and may have a position in mentioned securities at the time of publication. Any opinions expressed herein are solely those of the author, and do not in any way represent the views or opinions of any other person or entity.


 Trading Into Inflection Point")