The Morning Report: Markets Struggling At Decision Regions
Stock market futures are struggling with price congestion areas this morning. Look for higher lows to continue, but failure to hold 1883 on S&P 500 Futures (ES) and we could easily test 1860 before bouncing.
If that happens, futures buyers will have more to prove once again. Longer time frame price resistance levels are sitting now at 1892.5, 1906.75, and 1915.
For S&P 500 futures, intraday price resistance sits near 1904.75. Intraday price support sits at 1887.5 – (congestion sits at 1892 and 1897– watch these midlines – they will gives clues to moves ahead). Congested charts for stock market futures mean range bound trading ahead. Pullbacks will likely be bought, and expansions upward sold.
Shorter time frame momentum indicators are drifting. Longer cycles for S&P 500 futures are downward trending but lifting – still firmly in negative territory- this means larger upside resistance tests should be sold.
See today’s economic calendar with a rundown of releases.
THE RANGE OF TUESDAY’S MOTION
Crude Oil Futures (CL_F)
Crude Oil futures prices just completed a relief bounce getting right up into the targets I mentioned all last week into 32.74 (I mentioned 32.6- 32.8 – see Friday’s post). We are now backing off those levels but stabilizing. Buyers are clearly defending 31.06.
Trading ranges are between 31 and 32.2, with 31.6 being an important support level to hold on any retrace.
Moving averages in crude oil are still clearly negative on longer time frames but holding bounces. These should continue IF the chart can breach and hold 32.8 – that’s a big ‘IF’ for now.
Intraday long trade setups suggest a long off 31.69 or 31.12 if the chart holds that area into 31.8, 32.12, 32.35, 32.6, 32.7 and 33.2 but charts get very muddy in those regions above– see the blog for levels above that region.
Intraday short trade setups suggest a short below a 31 failed retest or a rejection of the 32.7 with negative divergence showing sends us to 32.4, 32.12, 31.94, 31.68, 31.45, 31.15, 31.05, 30.69, 30.46, 30.29. Momentum on longer time frames remains sloping negative but somewhat divergent as we move north.
E-mini S&P 500 Futures (ES_F)
Below is a S&P 500 futures chart with price support and resistance trading levels for today. Click to enlarge.
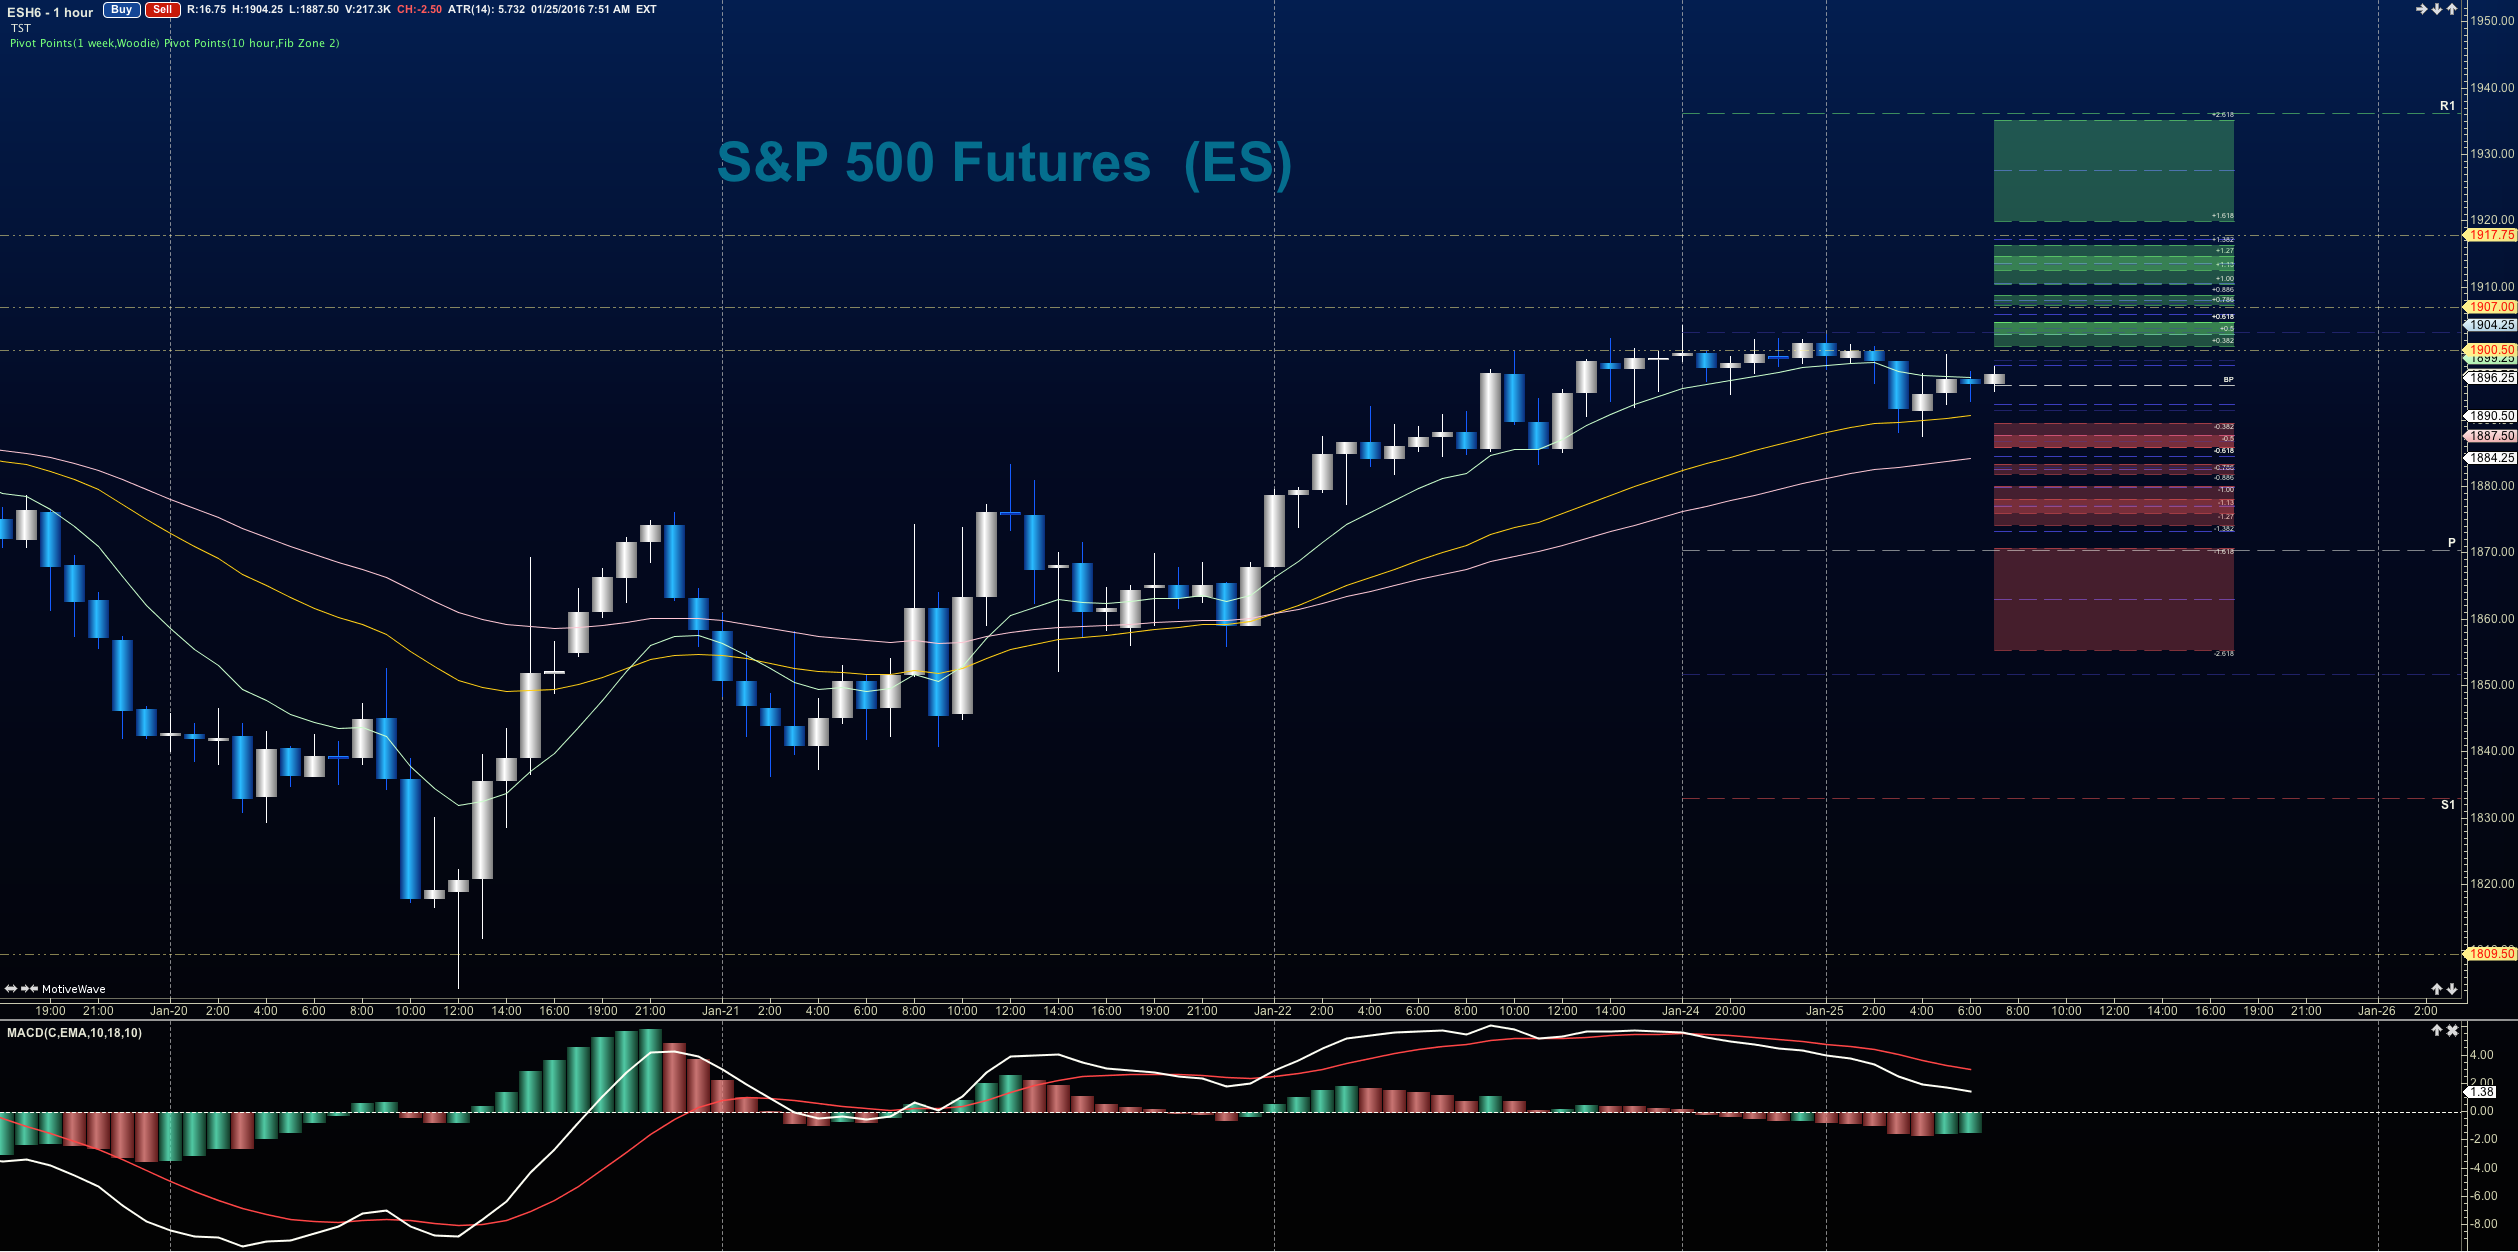
The S&P 500 futures chart is holding steady just under key price resistance levels – currently testing 1895. Primary support sits at 1887, but a new band of buyers is attempting to hold 1892 as upper support. Above 1904.75, and the air opens up a bit for range expansion on S&P 500 futures.
Upside motion in futures is best setup on the breach of and positive retest of 1904.5 – or a bounce off 1887.5 (as long as momentum shows this as likely to hold- watch momentum or the drift lower is possible) – Price targets from 1904.5 are 1907, 1872.5, 1911.25, 1914.5, 1916.25, and 1921.5. Big resistance test is now at the region between 1902.25 – 1904.5. The chart could expand under positive strength into 1921, so be careful to watch the higher lows to keep you on the right side of the trade.
Downside motion opens below the failed retest of 1886.5 or at the failure to hold 1914.5 bounce – but that would likely be into higher support. Retracement into lower levels from 1886.5 gives us the targets at 1883.5, 1881, 1878.5, 1871, 1868.5, 1861.25, and perhaps 1857.75 if the chart really tries to test the important breach level there.
If you’re interested in the live trading room, it is now primarily stock market futures content, though we do track heavily traded stocks and their likely daily trajectories as well – we begin at 9am with a morning report and likely chart movements along with trade setups for the day.
As long as traders remain aware of support and resistance levels, risk can be very adequately managed to play in either direction as bottom picking remains a behavior pattern that is developing with value buyers and speculative traders.
Twitter: @AnneMarieTrades
The author trades stock market futures every day and may have a position in mentioned securities at the time of publication. Any opinions expressed herein are solely those of the author, and do not in any way represent the views or opinions of any other person or entity.


