S&P 500 Futures Trading Chart – November 7
MARKET COMMENTARY
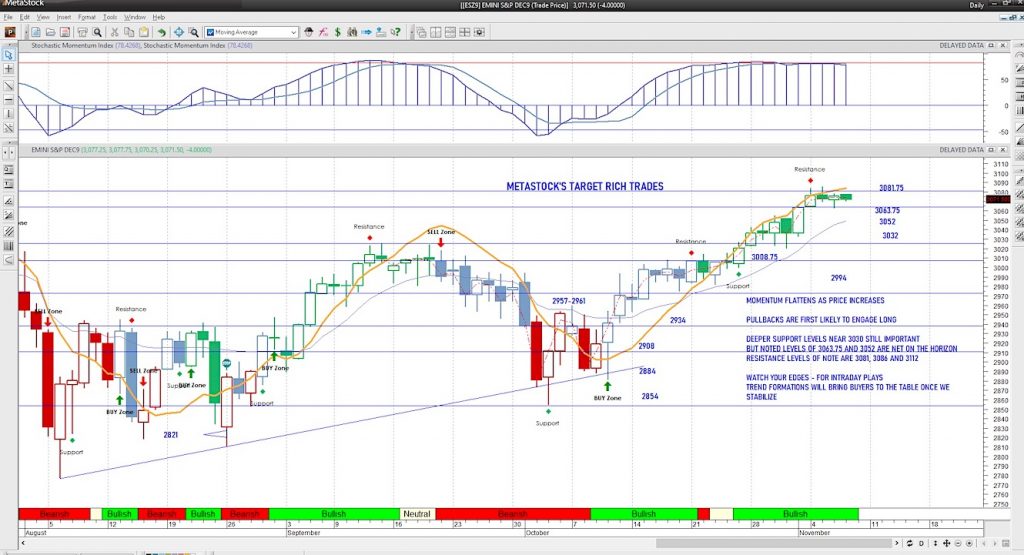
Traders continue to hold us in breakout territory as we hold price over time. Lower tests on S&P 500 futures bring buyers into support regions.
Bullish signals hold as chatter about the possibility of failed breakouts float across media streams.
Price action still suggests that fades will be bought up and we are quite likely to break higher once more.
If you are looking for shorts, consider the weakest instruments that look like they are recovering – as it is likely they are getting caught up in the fray of enthusiasm for higher prices, else the trade is resistance to support and out quickly as countertrend moves short are likely to have a short shelf life in this market. Pullbacks, even if they jolt us by their deepness will very likely be buying areas, especially at the first pass into weekly levels.
WEEKLY PRICE ACTION
We shall keep looking for a close over 3072 to confirm a weekly breakout but dips near 3052-3063 are also presenting possibilities as a draw to a support test.
Positive momentum is steady, but no longer building. Weekly patterns remain quite strong as do the monthly patterns- from a bullish perspective. Be cautious adding to swing positions in either direction – particularly if you are considering shorts- as markets are not currently showing that short positions can gain traction at this time.
COMMODITY & CURRENCY WATCH
Finally, as we have held higher in the indices, gold has slipped below 1500 and having trouble recovering the zone. Traders are trying to hold above 1492 after a bounce off 1482ish. We need a real capitulation selling event for gold to find its real support and it could be 100$-120$ below its current price near 1492. Breakout patterns look like tests of 1520 to 1535.
Use caution with size – there is significant risk in the charts. The US dollar has recovered a major support region and now holding above 97.5 and re-entering the long channel. WTI sits below 57, near 56.3 after sellers pushed the high back down into congestion. Resistance sits at 57.85. EIA today showed a build as did the API.
TRADING VIEW & ACTION PLAN
Buyers will have more strength above 3078 in the ES_F which will hold as minor breakout region with sellers continuing to wage a battle there. Broadly speaking, buyers have the advantage as long as we hold 3063- which is where we bounced in Wednesday’s range. The support below that is 3052ish, so the loss of 3063 opens that level below.
Be patient and wait for your setups – this means we wait for key support to engage and we don’t step in front of moves. Understand what your levels mean and prepare for the potential behavior at those levels. Realize that we could bounce higher than anticipated and fade deeper than anticipated before returning to the trend and range – Follow the trend in the shorter time frames and watch the price action.
The theme of motion is:
POSITIVE AS LONG AS WE HOLD ABOVE 3078ish today (with big spikes likely fading back into congestion)
NEGATIVE AS LONG AS WE HOLD BELOW 3062ish today (with sharp bounces failing and deep pullbacks holding)– choppy inside the range.
Do what’s working (that means follow short trend and momentum signals while in the intraday spaces) and watch for weakness to develop away from your trade direction in order to leave.
Learn more about my services over at The Trading Book site.
Twitter: @AnneMarieTrades
The author trades stock market futures every day and may have a position in mentioned securities at the time of publication. Any opinions expressed herein are solely those of the author, and do not in any way represent the views or opinions of any other person or entity.


 Ready To Break Out?")
