S&P 500 Futures Trading Outlook for June 10, 2016 – The damp momentum allowed us to anticipate the selloff as we stretched into the highs yesterday. And this morning, S&P 500 futures are hovering dangerously around support levels that are important for buyers to hold up here – 2089.25. My decision yesterday to watch for lower highs gave us the space to short, and this shorting action continues here with the roll of the new contracts expiring now in September. The deterioration of price into the support area overnight and into the morning is a little troubling for continued bullish activity. Bounces are likely to be sold in these formations. The levels, 2099.75 to 2105.75, are resistance regions today. Any range expansions should be sold into higher support, and we are lightly to test lower levels on any bounce event. Support today looks like 2089.5 – 2082.5. Below 2091.25, charts become more vulnerable to selling pressure.
See today’s economic calendar with a rundown of releases.
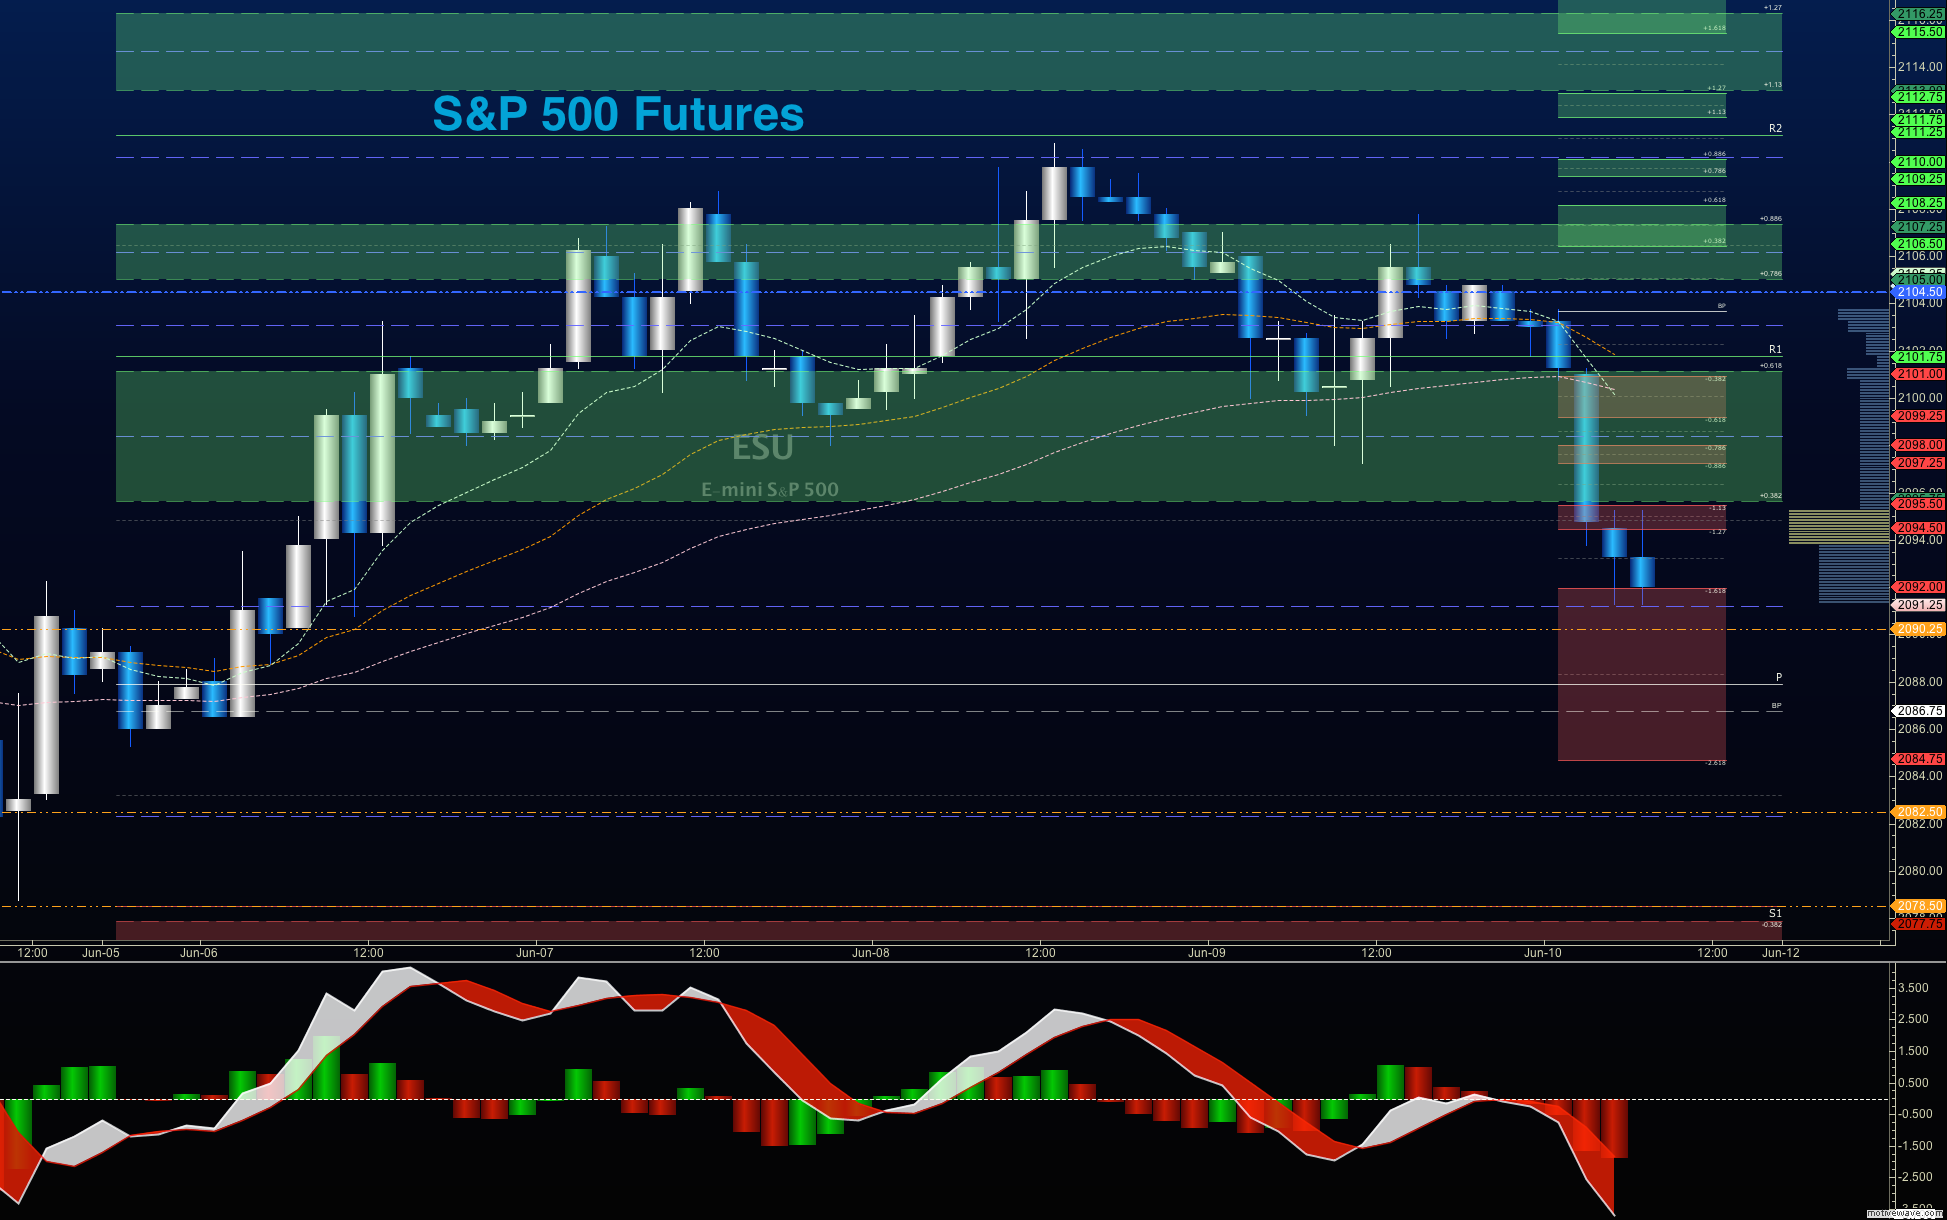
THE RANGE OF TUESDAY’S MOTION
E-mini S&P 500 Futures (ES_F)
Futures Trading Outlook for June 10, 2016 (S&P 500) –
Upside trades – Favorable setups sit on the positive retest of 2096.75, or a positive retest of 2089.5 with positive momentum. I use the 30min to 1hr chart for the breach and retest mechanic. Targets from 2089.5 are 2091.5, 2095.75, 2097, 2099.5, 2102.25, 2105.75, 2109.25, 2113.5, 2115.25, and perhaps 2117.5, and 2119.25, if power remains with the buyers. Seeing more negative momentum. I will be watching for failed bounces, but with return to lower lows, or at least the retest of the low. Momentum remains weak.
Downside trades- Favorable setups sit below the failed retest of 2089.5 or at the failed retest of 2102.25 with negative divergence. It is important to watch for higher lows to develop with the 2102.25 entry, if the strength of motion shifts back to the buyers. Retracement into lower levels from 2102.25 gives us the targets 2099.5, 2096.25, 2094.25, 2092.5, 2090.5, and perhaps back to 2082.5, and 2078.5.
Have a look at the Fibonacci levels marked in the blog for more targets.
Nasdaq Futures
Outlook for Nasdaq futures for June 10, 2016 –The NQ_F faded significantly, and its weakness in prior days certainly did telegraph the probabilities of lower tests. Weak momentum continues this morning, and now in negative territory. Any bounce action will into resistance and present selling opportunities. Buyers will be emboldened above 4502.5, but resistance again will make recapturing key support areas quite difficult.
Upside trades on Nasdaq futures – Favorable setups sit on the positive retest of 4478.5, or a positive retest of 4462.5 with positive momentum. I use the 30min to 1hr chart for the breach and retest mechanic. Watch for the lower high to develop in the long opening at 4462.5, as momentum sits in favor of sellers this morning. Targets from 4462.5 are 4468.5.25, 4472.25, 4475.5, 4478.5.75, 4483.25, 4485.5, 4490.5, 4494.25, 4497.5, 4502.25, 4512.25, 4515.5, 4520.25, 4524.5, 4529.5, and 4534.25. Range expansions above here should fail under the negative divergence.
Downside trades on Nasdaq futures – Favorable setups sit below the failed retest of 4478.5 or at the failed retest of 4499.75 with negative divergence. Retracement into lower levels from 4499.75 gives us the targets 4497.5, 4479.5, 4472.25, 4464.75, 4462.5, 4456.5, 4450.25, and perhaps 4434.5 – but those deep levels only come about if we have a significant shift of momentum.
Crude Oil
Outlook for Crude Oil futures (CL_F) for June 10, 2016 – Negative momentum has continued to hold as prevalent with the sell off at 51, and moves up from the last two up days have been completely retraced with yesterday and this morning’s selling. Sellers are currently in control of the chart as it slips into support.
The trading range for oil suggests support action near 49.24, and resistance behavior near 50.78.
Upside trades on crude oil futures can be staged on the breach of 50.07, or at a pullback into 49.27. I often use the 30min to 1hr chart for the breach and retest mechanic. Targets from 49.27 are 49.43, 49.68, 49.98, 50.06, 50.23, 50.41, 50.65, 50.92, 51.12, 51.35, and (unlikely at this writing) 51.58.
Downside trades on crude oil can be staged on the failed retest of 49.65, or at the failed retest of 50.24 with negative divergence. These setups give us targets from 50.24 into 49.98, 49.72, 49.4, 49.27, 49.04, 49.98, 48.86, 48.7, 48.49, 48.27, 47.97, and perhaps 47.68 to 47.24.
Visit TheTradingBook.com for more information.
If you’re interested in the live trading room, it is now primarily stock market futures content, though we do track heavily traded stocks and their likely daily trajectories as well – we begin at 9am with a morning report and likely chart movements along with trade setups for the day.
As long as the trader keeps himself aware of support and resistance levels, risk can be very adequately managed to play in either direction as bottom picking remains a behavior pattern that is developing with value buyers and speculative traders.
Twitter: @AnneMarieTrades
The author trades stock market futures every day and may have a position in mentioned securities at the time of publication. Any opinions expressed herein are solely those of the author, and do not in any way represent the views or opinions of any other person or entity.


