The March 23 outlook for S&P 500 futures: A second doji candle day is building with price little changed overnight. GDP and Home Sales are on the economic release frontier. Even so, charts are still holding a bullish trending formation, testing new near term resistance currently -momentum is bullish but waning.
Pullbacks are still likely to find buyers. For bulls, the S&P 500 futures support level to defend is at the region between 2025-2027, and 2021-2017.75 slightly below.
Price resistance sits above 2042.5-2047.5 (we hit the top end of this yesterday). Tests of these ranges are likely to fail and retest, before continuing in the direction of either break – deep support is still likely to be defended. Buyers continue to defend 2032-2034 as near-term support.
Momentum on the four hour chart is positive, but drifting a bit lower –slope of trend suggests buyers will still show up at key support levels. Continue to watch for higher lows to continue, if buyers hold momentum and bounce price off support. The failed retest of the 2025 area will signal more bearish momentum.
Shorter time frame momentum indicators are muted but holding bullish, but weakening somewhat -this makes buying breakouts somewhat suspect. Take profit quickly if you choose the breakout.
See today’s economic calendar with a rundown of releases.
THE RANGE OF THURSDAY’S MOTION
Crude Oil Futures (CL_F)
The EIA Report this morning. Crude Oil still appears a bit top heavy; support was briefly broken yesterday but recovered quickly. The level for buyers to hold is 40 for bullish action to hold. Buyers will become less aggressive if we lose that level today. Buyers are showing up near 40.8-40.9.
Today, the trading ranges are between 40.31 and 41.96. Breaks of these levels are likely retrace before moving again in the direction of strength.
Moving averages in oil show tight coiling, and slightly dampening momentum on longer time frames. Resistance sits near 42.46-42.8 – it seems buyers have their eyes on that range, but have not been able to test the upper edges of that space yet. Sellers are now firmly camped at 41.97.
Intraday long trading setups on crude oil suggest a long off a breach of 41.97 positive retest (check momentum here), or 41.54 bounce and hold into 41.89, 42.25, 42.48, 42.78, 43.01, and if buyers hold on, we’ll see 43.12 to potentially 43.46.
Intraday short trading setups suggest a short below a 41.24 failed retest with negative divergence, or the failed retest of 41.75 sends us back through targets at 41.36, 41.25, 40.87, 40.42, 40.04, 39.6, and 38.67, if sellers hang on.
E-mini S&P 500 Futures (ES_F)
Below is a S&P 500 futures chart with price support and resistance trading levels for today. Click to enlarge.
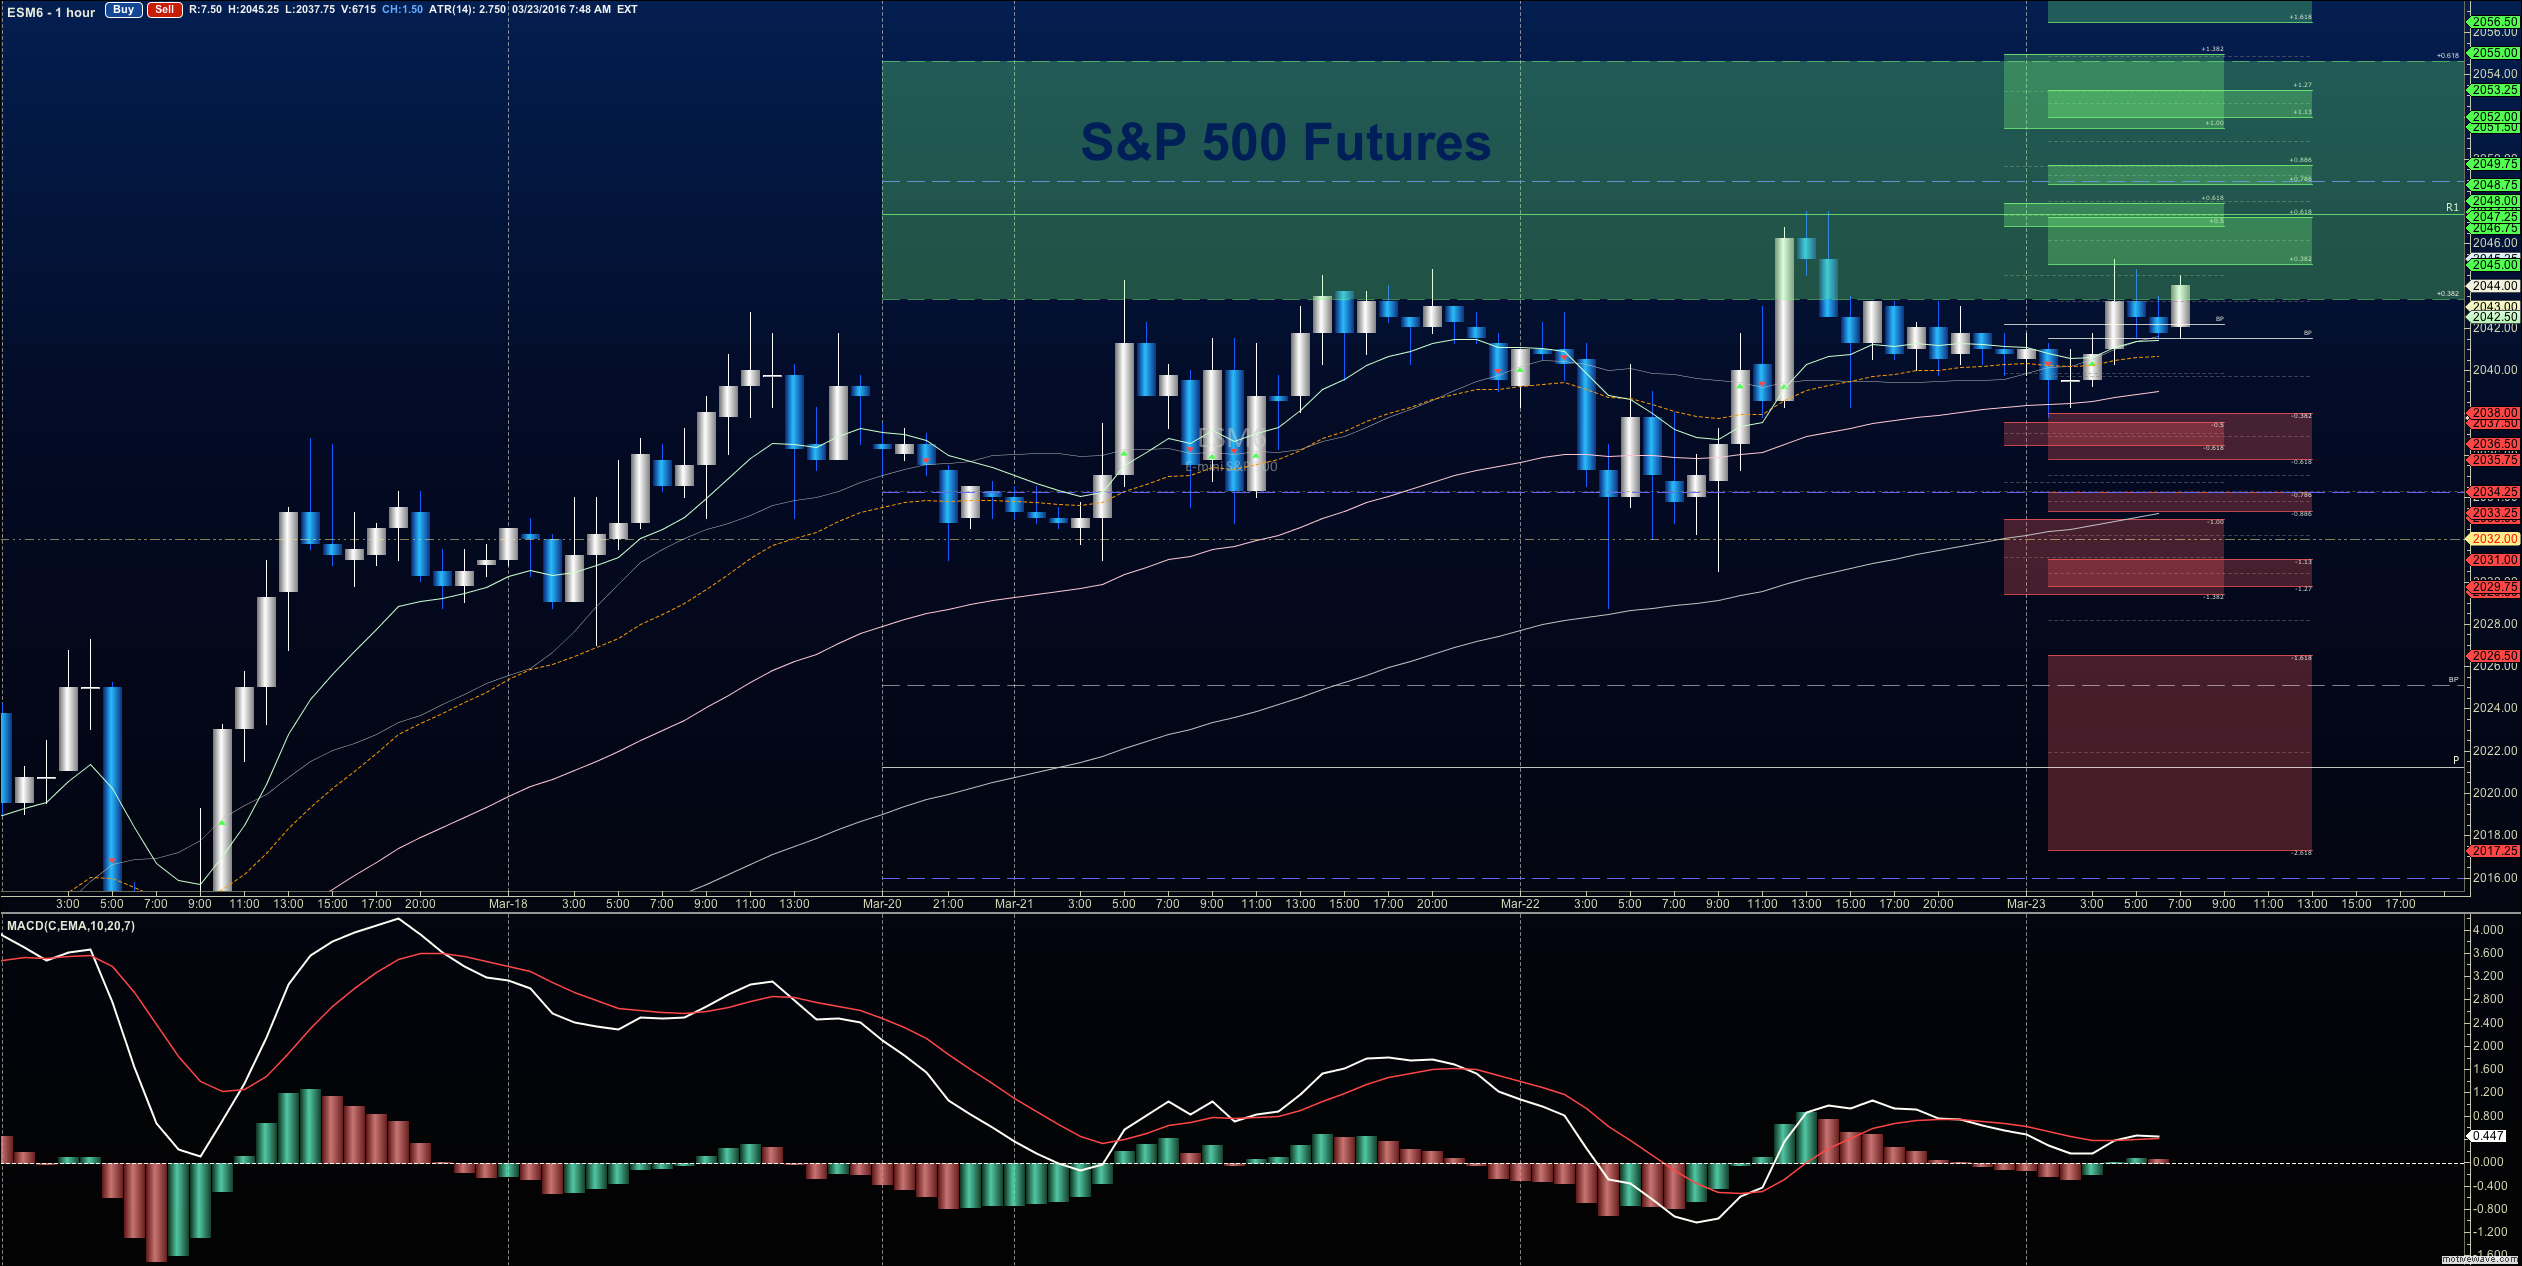
Buyers and sellers of S&P 500 futures battled in contested regions near 2034 for three days before moving above to settle near 2041 as support. The levels between 2047.5-2044.5 serve as front line resistance, with 2025.5-2031.5 now as support. Stretches north could see 2054.5 as final targets north in this move, and deep support could be as far south at 2014. I suspect we have a greater chance of downside movement into support as the charts continue to look heavy, but buyers have been persistent.
Upside motion on S&P 500 futures has the best setup on the positive retest of 2037.75 or a recapture of 2044.5 with positive momentum. I use the 30min to 1hr chart for the breach and retest mechanic. Targets from 2037.75 are 2040.5, 2042.5, 2044.5, 2047.5, 2049.5, and if we can catch a bid there, we could expand into 2051.75 and 2057.5. The higher lows will keep you on the right side of the long trade.
Downside motion opens below the failed retest of 2036 or at the failed retest of 2044.5 with negative divergence. Retracement into lower levels from 2036 gives us the targets 2034.5, 2031.75, 2028.75, 2025.5, 2021.25, 2019.5, 2015.5, 2012.25, 2010.25, 2005.5, 2001.75, and perhaps 1997.5 if selling really takes hold (unlikely in this formation, but clearly possible if buyers lose their footing).
If you’re interested in the live trading room, it is now primarily stock market futures content, though we do track heavily traded stocks and their likely daily trajectories as well – we begin at 9am with a morning report and likely chart movements along with trade setups for the day.
As long as traders remain aware of support and resistance levels, risk can be very adequately managed to play in either direction as bottom picking remains a behavior pattern that is developing with value buyers and speculative traders.
Thanks for reading.
Twitter: @AnneMarieTrades
The author trades stock market futures every day and may have a position in mentioned securities at the time of publication. Any opinions expressed herein are solely those of the author, and do not in any way represent the views or opinions of any other person or entity.


: Showing Some Signs of Emerging Strength")
