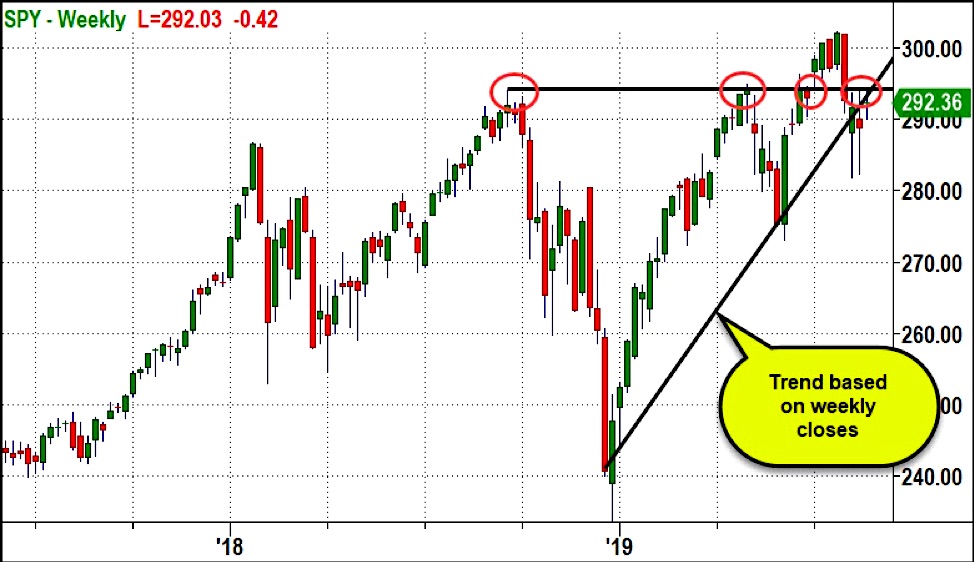
Today’s chart of the day is a chart of the SPDR S&P 500 ETF NYSEARCA: SPY. Note that it’s a “weekly” chart.
As you’ll see in the chart image able, 195 was resistance 3 times prior to the S&P 500 ETF (SPY) making all-time highs.
Now it’s been resistance for the last 3 weeks.
The trend line from the Dec. 2018 low is based on weekly closes. SPY closed under it last week.
If SPY doesn’t close over 195 this week it will be the second close under the trend line.
Stock Market ETF Levels:
S&P 500 (SPY) Support Friday’s high, 289.33 Resistance at 50-DMA and swing high area, 294.
Russell 2000 (IWM) Support around 149 area.Resistance at 200 DMA, 151 then 152.70.
Dow (DIA) I’d just focus on range low, 254 and range high 264.60.
Nasdaq (QQQ) Support area at 186, then 184. Needs to break the swing high, 189.70.
KRE (Regional Banks) Support around 49.50. Resistance at the range high at 51.70 then 51.50.
SMH (Semiconductors) Tight 4-day range.Support at the gap fill at 110.Resistance at 116, then 120.
IYT (Transportation) Support at pivotal area, 180. Resistance 186 then 191.
IBB (Biotechnology) Sitting just under the 200 DMA. Support at 104. Looks interesting if it can close over 107.
XRT (Retail) Nice strong day. Support at 39.50, then swing low 37.46. Major resistance around 41.30.
Twitter: @marketminute
The author may have a position in the mentioned securities at the time of publication. Any opinions expressed herein are solely those of the author, and do not in any way represent the views or opinions of any other person or entity.


