The S&P 500 closed last week at an all-time closing high. And as the new week starts, a majority of the major stock market indices are trading at or near all-time highs.
Let’s review the chart…
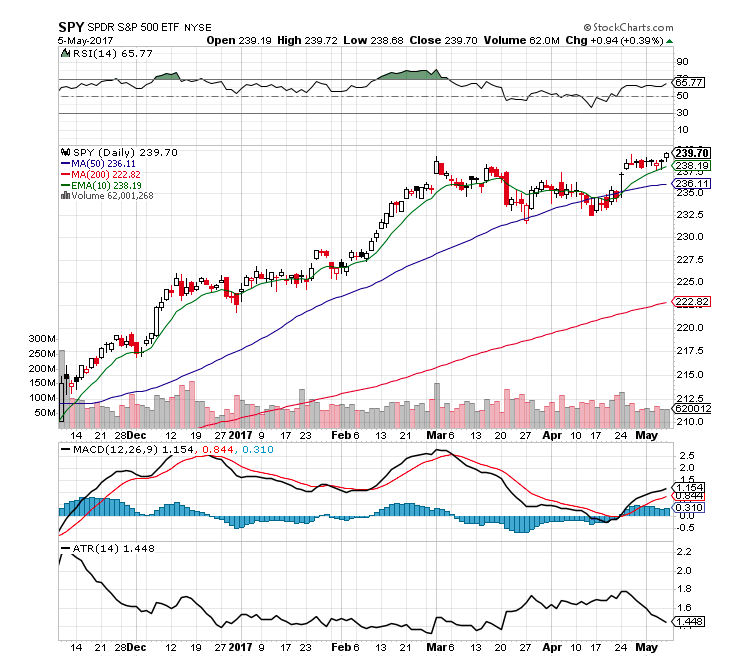
10 fast facts about the SPDR S&P 500 (NYSEARCA:SPY):
1. There is nothing more bullish than a price trading at an all time high.
2. SPY price remains in an uptrend and above all moving averages.
3. The 10 day / 50 day crossover is a bullish signal.
4. A 65.77 RSI is near overbought and could be signaling more price building in this range before more of an uptrend.
5. The volatility has dropped and price is now in a very tight trading range. (ATR)
6. The MACD remains under a bullish crossover.
7. A VIX at 10.57 allows traders to buy very cheap SPY put options as insurance for long term holdings. This can lead to little selling as a cheap hedge replaces a stop loss.
8. The market is trading in this range with low volume.
9. Too many prognosticators calling for a market crash for too long when this market will barely even pull back.
10. The money remains in buying any small pullbacks in price.
SPDR S&P 500 Chart – $SPY
Thanks for reading.
Twitter: @SJosephBurns
Read more on the blog NewTraderU.
Any opinions expressed herein are solely those of the author, and do not in any way represent the views or opinions of any other person or entity.


