In the last S&P 500 trading update on the 5th of March I mentioned that “waning momentum suggest that the market is susceptible to a reversal”.
I also mentioned that “Closing below Monday’s low will give more credence to that blue count and suggest that a correction has begun”.
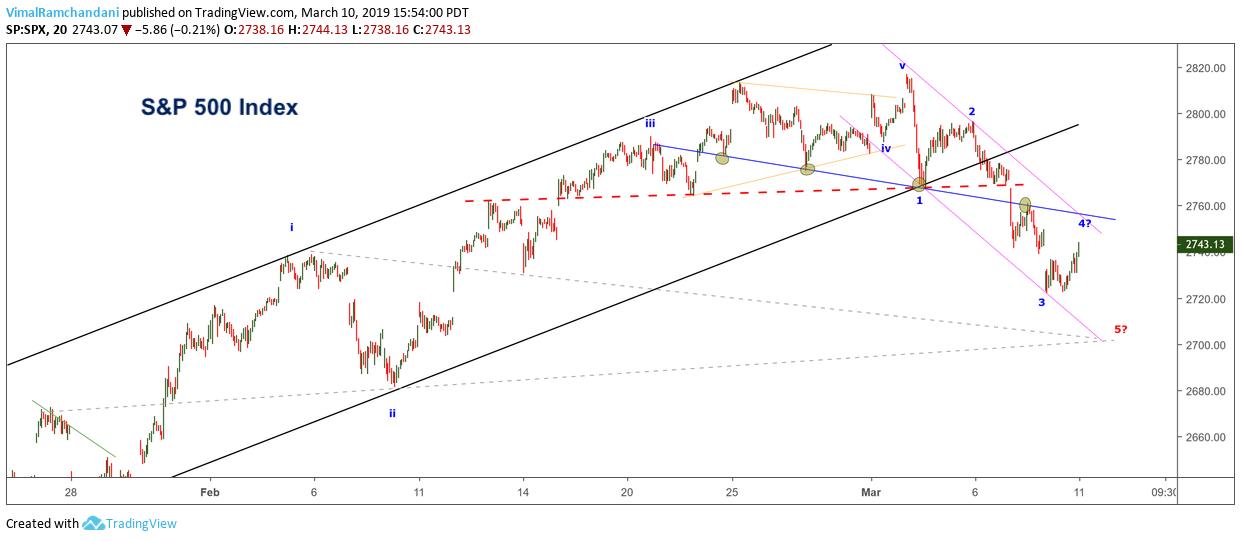
We saw that take place on the 7th of March with a decent move down to complete 3 waves down. It is very likely that the 3rd wave ended at approx. 2722 on the 8th of March and we are currently in the 4th wave of this “potentially impulsive” decline.
The 4th might already be over if BA shows declines in the futures market after the latest Boeing plane crash. If not, the expectation is for the 4th to end between a range of 2750-2760.
You can see in the chart below that there are multiple trendlines and that meet in this range. I have highlighted the pivots of the blue trendline to show its significance. There is also a some important Fibonacci retracement levels of wave 3 at this zone.
I think a defensive stance remains warranted until we negate this potential impulsive by either trading into the wave 1 zone or we see an impulsive move above the purple channel and the red trendline. If we get a 5th wave down, then potential target area could be the 2700 level.
S&P 500 Chart
Twitter: @vimalvr
The author may have a position in mentioned securities at the time of publication. Any opinions expressed herein are solely those of the author, and do not in any way represent the views or opinions of any other person or entity.
Editor’s note: at 9:38 am CST the text description of the chart image was corrected.


