The S&P 500 (INDEXSP: .INX) rallied to 2816.88, which was a new intraday extreme.
That would seem bullish on the surface, but this move higher was not confirmed by the Dow Jones Industrial Average and Russell 2000 Index.
As well, overbought technical measures and waning momentum suggest that the market is susceptible to a reversal.
That said, at this moment in time, price is unable to confirm those warnings. So let’s look at a couple of charts to help us find our way.
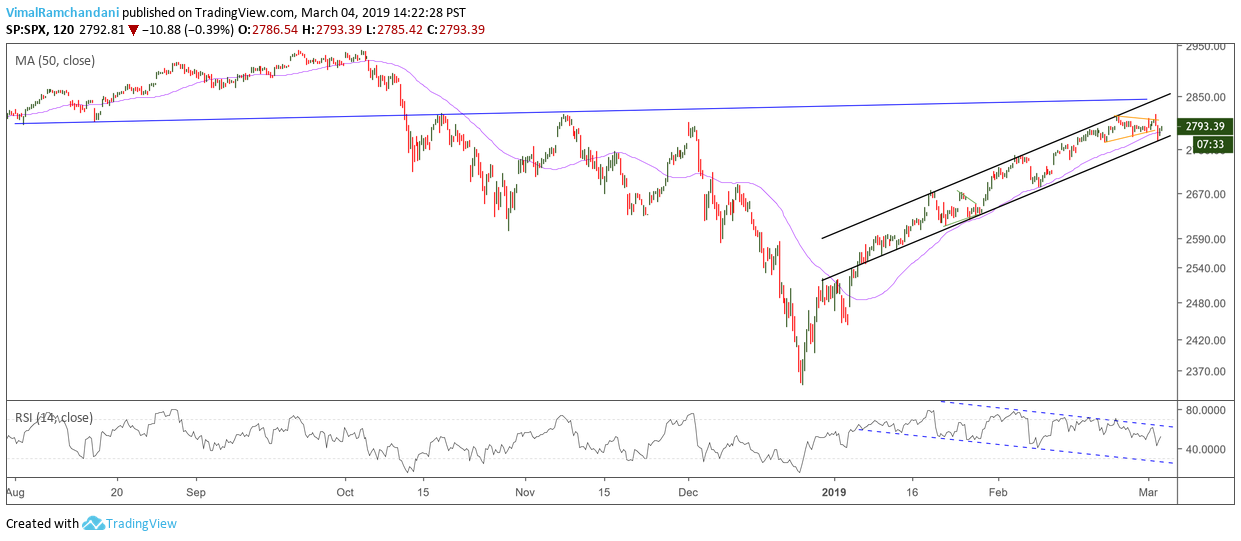
You will note below in the 1st chart below, that the black channel has served a useful purpose. Some folks were wondering why the market reversed from the today’s low at 2767.6. The market bounced for the 6th time off this lower channel line.
We also closed above the 50MA (purple worm) on this 120 minute chart shown. This moving average has proved to be a good pivot of sorts on this time frame. As mentioned earlier, momentum (denoted by the RSI) is diverging and portrays a market that is in the latter stages of an incline.
S&P 500 Index (120Min) Chart
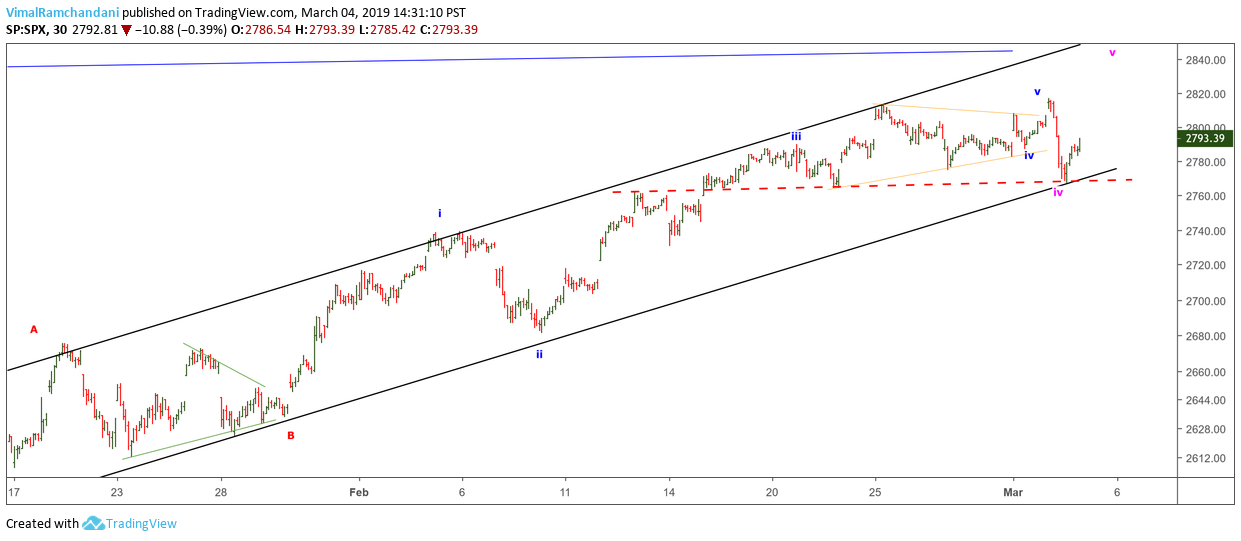
You will note the 30 minute chart below of the S&P 500. If the S&P 500 declines below today’s low at 2767.6, it will violate the black channel and break below the red (dashed) pivot line.
I have taken the liberty of showing a near term Elliott wave count (blue) with an alternate count in purple.
To keep things simple, we see alternation in this sideways “potential” 4th wave when you contrast it to the simple and sharp decline that we saw in the 2nd wave.
The purple count suggests that the 4th wave is a “flat” pattern (sideways affair) and new highs are possible. The blue count suggests that the 4th wave was a “triangle” and we have already seen a small 5th and final wave that completed at today’s high of 2816.88.
S&P 500 Index (30Min) Chart
Conclusion: Closing below Monday’s low will give more credence to that blue count and suggest that a correction has begun. We will soon find out.
Twitter: @vimalvr
The author may have a position in mentioned securities at the time of publication. Any opinions expressed herein are solely those of the author, and do not in any way represent the views or opinions of any other person or entity.


