Stocks and bonds declined last week, setting the tone for what will likely be a challenging October for investors.
Look for an uptick in volatility in the days/weeks ahead.
S&P 500 Cycle Outlook for the Week of October 8, 2018:
– The stock market fell last week, with the S&P 500 (SPX) down 28 points to 2886, a decrease of 1%.
– Stocks tumbled in part due to the increase in interest rates that resulted from a tumble in the bond market.
– Our projection this week is for the SPX to continue to decline, with a target zone of 2817-2850 by October 23.
The 10-year treasury futures fell 1% last the week. This was in part a reaction to Fed Chair Jerome Powell speech in which he emphasized that he was ready for action.
Specifically, Powell said that he would, “Resolutely conduct policy consistent with the 2% inflation objective, and stand ready to act with authority if expectations (change).”
He also stated that he expects the Fed will continue to move at a gradual pace. However, while September nonfarm payrolls came in below expectations, the unemployment rate improved to 3.7%, which is the lowest rate in nearly 50 years.
With a new earnings season kicking off last week, and with 21 companies in the S&P 500 having reported Q3 earnings, 18 have beat earnings estimates and 15 have beat sales estimates, according to FactSet.
The question is whether earnings will continue to matter, with interest rates soaring. As the economy blazes forward, the probability of higher inflation may have also increased, which likely contributed to the move in bonds described earlier. This of course produces higher interest rates which could slow the economy – as well as the stock market.
S&P 500 (SPX) Daily Chart
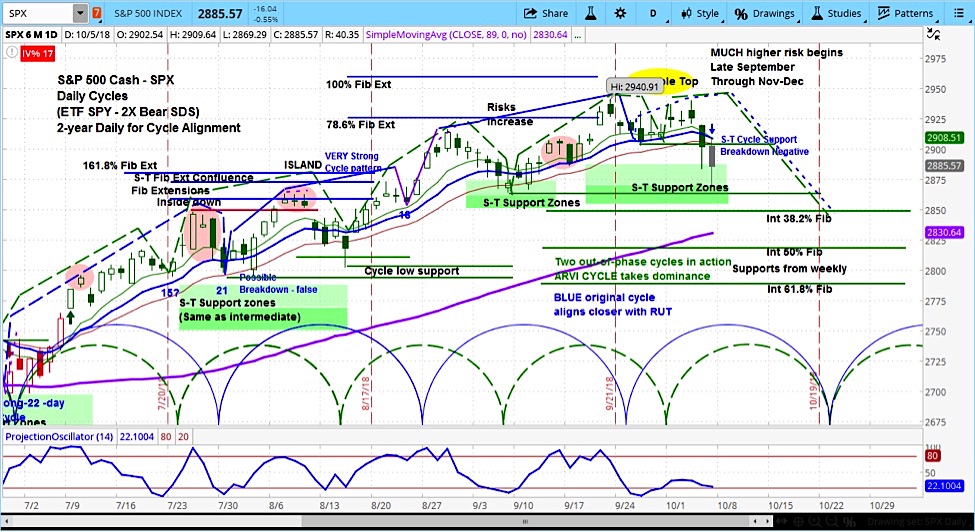
Our analysis of the S&P 500 is for stocks to continue their move lower, with a target zone of 2817-2850 by October 23. On Friday, the Slim Ribbon indicated a shift in momentum from bullish to neutral. As discussed in our Market Week Show, we believe this shift is significant and will continue to watch this indicator closely.
For more from Slim, or to learn about cycle analysis, check out the askSlim Market Week show every Friday on our YouTube channel.
Twitter: @askslim
Any opinions expressed herein are solely those of the author, and do not in any way represent the views or opinions of any other person or entity.


