The rally off the December stock market lows has been strong, to say the least.
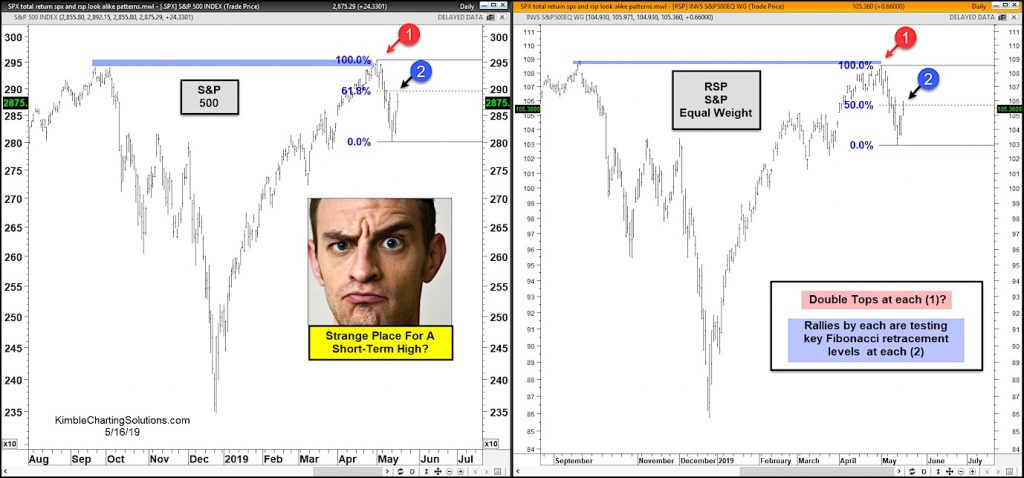
The S&P 500 rallied 25 percent before hitting and testing the 2018 high.
The old highs proved to be formidable resistance and ushered in some volatility in May… and a 5 percent pullback.
In today’s 2-pack, we look at that resistance level – could that be a double top? We can see similar patterns develop on the S&P 500 Index and its Equal Weight counterpart.
Both indexes are testing short-term Fibonacci retracement levels of the recent decline at point (2).
What takes place here after potential double top highs will be important. Stay tuned!
S&P 500 Index vs S&P 500 Equal Weight Index
Note that KimbleCharting is offering a 2 week Free trial to See It Market readers. Just send me an email to services@kimblechartingsolutions.com for details to get set up.
Twitter: @KimbleCharting
Any opinions expressed herein are solely those of the author, and do not in any way represent the views or opinions of any other person or entity.


: Showing Some Signs of Emerging Strength")
