In the scheme of the greater secular bull market, the current stock market correction is a blip on the radar.
However, if the recent acceleration in selling doesn’t abate soon, market bulls could find themselves in a pickle.
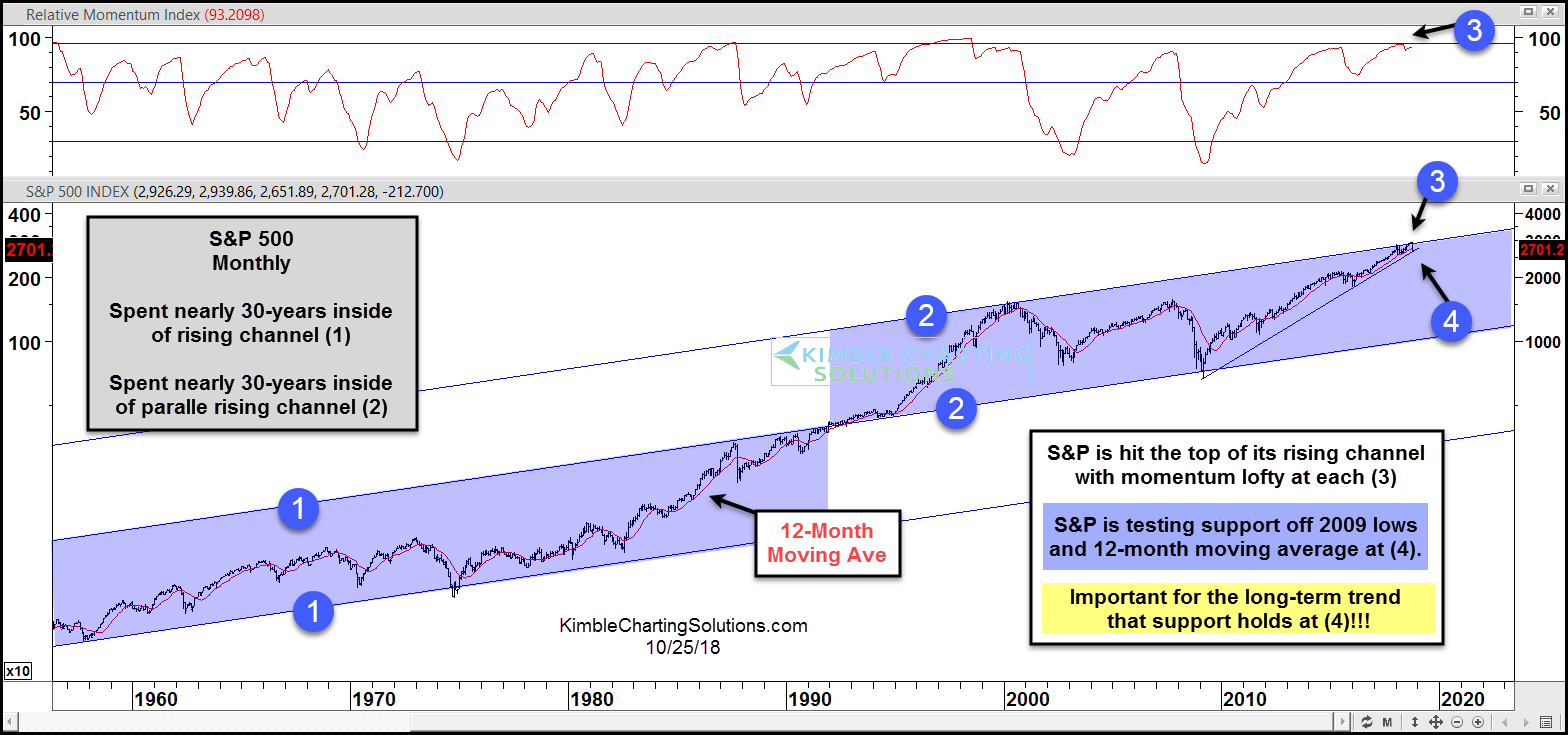
Below we take a look at the S&P 500 (NYSEARCA:SPY) on a monthly basis since the mid-1950’s.
The S&P has spent nearly 30-years inside of parallel rising channel (2). The rally off the bottom of the channel in 2009 has taken prices up to test the top of the channel at (3), as momentum is at lofty levels, where some selling pressure started.
The small decline of late has it testing rising support off the 2009 lows and its 12-month moving average at (4). SUPPORT IS SUPPORT UNTIL BROKEN!!!
If support fails to hold at (4), it would send a message that the long-term upward trend is changing. What happens at (4) friends is very important for the big picture!
S&P 500 Chart – 60 Years
Twitter: @KimbleCharting
Any opinions expressed herein are solely those of the author, and do not in any way represent the views or opinions of any other person or entity.


