There is just one fly in the ointment of the thesis that a tradable bottom is in and that the current stock market rally has legs. And it warrants some consideration.
As a pattern recognition guy, I’m constantly scanning charts for potential patterns that have symmetry and bear significance.
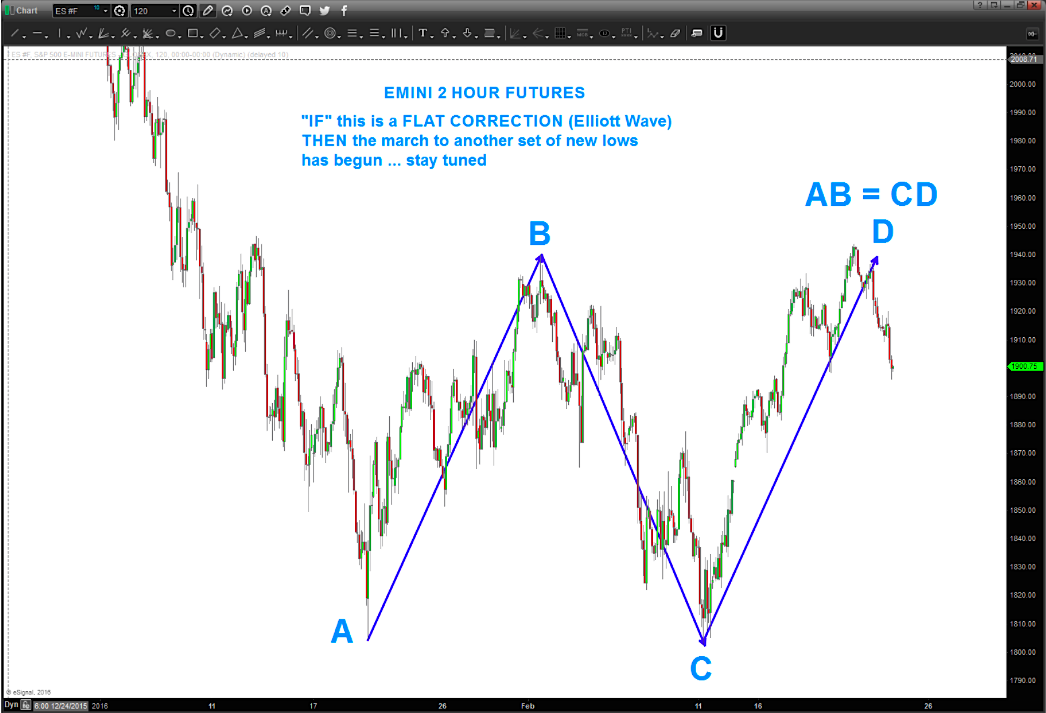
The chart below is of the S&P 500 E-Mini Futures (from yesterday) and it shows why the market is near a critical juncture (especially with today’s rally). Basically, it either breaks out above recent highs and confirms that this stock market rally has legs. Or it breaks down and makes new lows.
Why?
There’s still a chance of a “flat correction”, where AB=CD. I’m not posting this to be bearish or bullish, but to show you that the recent highs (or there about) are an important focal point.
Like I said, the chart below is from yesterday and today we are retesting the highs. This is likely a crucial juncture for the stock market rally.
In short, the bulls want a breakout to new monthly highs, while the bears want the recent highs to hold. The battle lines are drawn.
S&P 500 E-Mini Futures Chart – 2 Hour
Thanks for reading.
Further reading by Bart: “Intel Stock Update: Weighing The $INTC Buy Patterns“
Twitter: @BartsCharts
Author does not have a position in mentioned securities at the time of publication. Any opinions expressed herein are solely those of the author, and do not in any way represent the views or opinions of any other person or entity.

")

")

 Rolling Over At Key Fibonacci Level?")
