The S&P 500 ETF (NYSEARCA:SPY) crept higher by just 0.25% last week. But that was a mirror image of the prior week, proving that the grind higher is relentless… and real.
Stay disciplined and tune out the noise – your process and strategy should keep you in the trend/trade until it stops working.
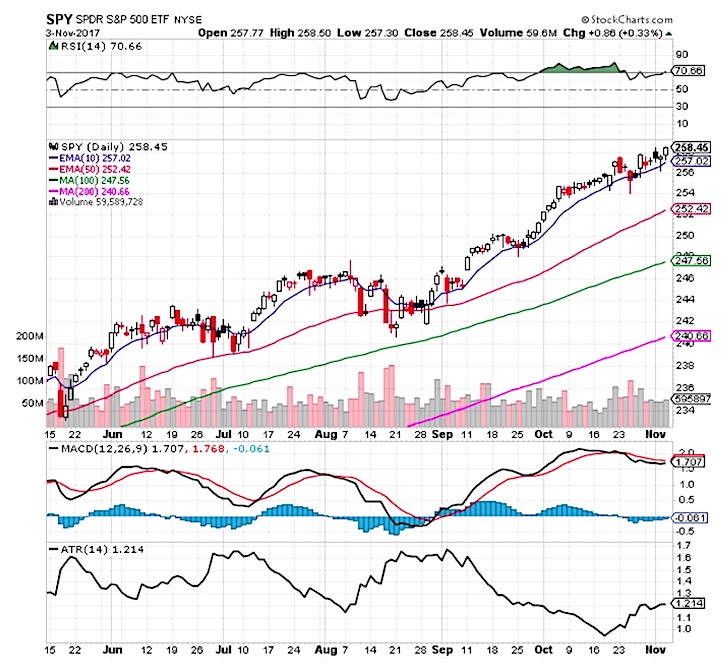
Here’s 10 chart signals occurring right now:
- The bullish signal of new all time highs continue.
- Price is bullish over all moving averages.
- The 10 day EMA has been a key short term support level.
- The RSI at 70.66 shows the momentum to trend through overbought price levels. The RSI over 70 has been a momentum signal since November of 2016 in one of the most overbought markets in history.
- $VIX is near an all time historical low in volatility at 9.14. Creating very cheap put options on $SPY as fear is very low at these price levels.
- The ATR continues to increase giving traders more of an intra-day trading range.
- The MACD is under a bearish cross showing signs of a market losing momentum.
- Volume trended lower last week as prices pulled back and then went higher. Volume remains healthy.
- $XLK Tech sector has been the leader for $SPY going to higher prices with $FB $AMZN $GOOGL, and $AAPL leading the market higher.
- The winning strategies in this market have not changed, buy the quick dips or buy and hold long and follow the trend.
Note that I am currently long $QLD and $UWM.
Twitter: @SJosephBurns
The author is long the noted Nasdaq 100 & Russell 2000 ETFs at the time of publication. Any opinions expressed herein are solely those of the author, and do not in any way represent the views or opinions of any other person or entity.


