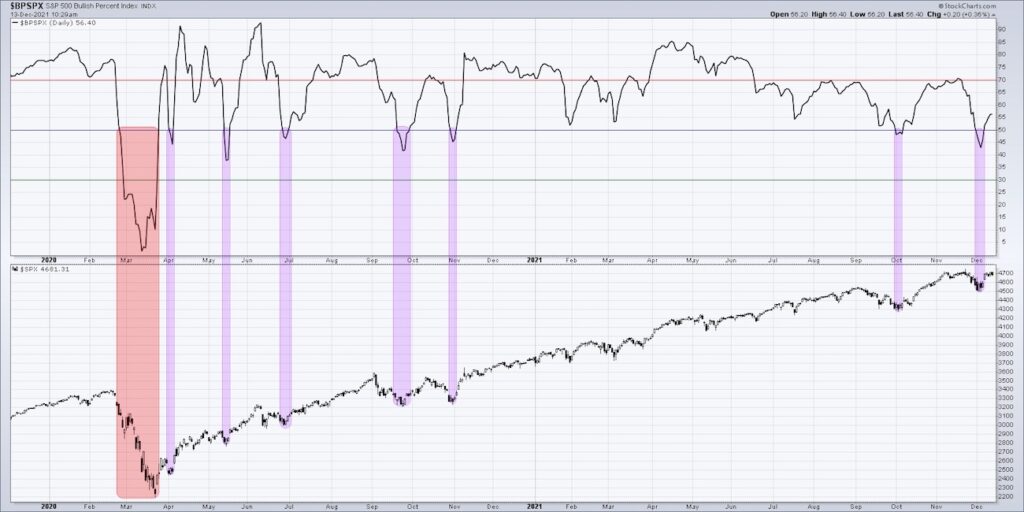
The Bullish Percent Index for the S&P 500 just went back above the key 50 level. We’ve seen this pattern six times since the March 2020 market low, and every instance has seen the S&P 500 move higher. But does this really suggest further upside for stocks today?
We’ll review all the times this Bullish Percent Index signal has occurred since 2009 and discuss how the current readings relate to previous market pullbacks. We’ll also include a brief primer on point & figure charts and show why the Bullish Percent Index can help investors understand the dynamics of the equity markets.
Here are a few questions we attempt to answer in the video:
What does the Bullish Percent Index really represent, and why is the 50% level such an important one to watch?
How do point & figure charts eliminate the noise of the equity markets and put the focus more purely on the underlying market trends?
How often has this buy signal occurred since 2009, and what tends to happen in the weeks and months after each signal?
Ready to upgrade your investment process? Check out my free course on behavioral investing!
(VIDEO) The Bullish Percent Index (BPI) Is Turning Positive
S&P 500 Bullish Percent Index Chart
Twitter: @DKellerCMT
The author may have positions in mentioned securities at the time of publication. Any opinions expressed herein are solely those of the author, and do not in any way represent the views or opinions of any other person or entity.

 Rolling Over At Key Fibonacci Level?")


