Wednesday witnessed several potentially important developments in the markets, but the message is not clear-cut.
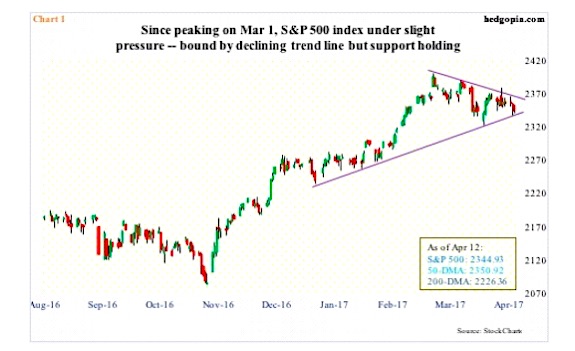
After straddling the 50-day moving average for nearly three weeks, the S&P 500 large cap index (INDEXSP:.INX) lost it yesterday, albeit not by much. This was the first time the index closed under that average since the November 8th election last year.
The S&P 500 has been trending lower since March 1 when it gapped up to an intraday high of 2400.98. Down below, the 50-day average provided support. This is now gone. The index currently sits at a rising trend line from late December last year (see chart 1 below).
For near-term direction, the next one to watch is support at 2300-plus, followed by 2322. The latter was the low reached on March 27.
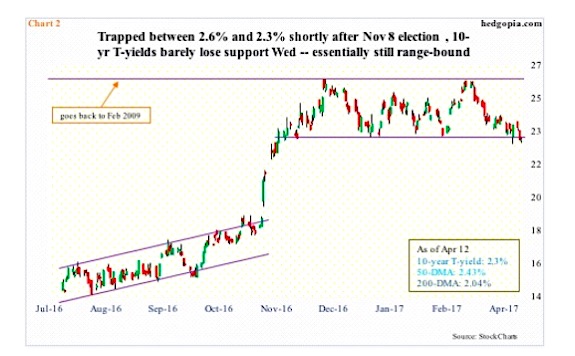
Also on Wednesday, 10-year Treasury yields broke down. Sort of. Yields fell to 2.28 percent intraday before rallying back to 2.3 percent in a doji session. The session low kissed the daily lower Bollinger band.
On December 15 last year, the 10-year tagged 2.62 percent before retreating. This resistance goes back to February 2009, and was tested again on March 13 – again unsuccessfully.
While bond bulls were defending 2.62 percent, bears were hammering out support at 2.31 percent (see chart 2 below). Wednesday, yields essentially closed on the low end of the range. A convincing loss of this support could potentially reverberate through a whole host of assets.
For now, defensives continue to draw bids. Both utilities and consumer staples are looking to break out.
Wednesday, XLU, the SPDR utilities ETF, rose 0.7 percent to 51.85. The 51-52 level has provided resistance since July last year. Similarly, XLP, the SPDR consumer staples ETF, rose 0.4 percent to 55.09. Again, 55 has been a ceiling since July last year.
A breakout in both XLU and XLP likely will be followed by a convincing range breakdown in 10-year yields. This potentially would cause the S&P 500 to break support, which in turn would result in a sharp spike in the Volatility Index (INDEXCBOE:VIX).
But is it too soon to bet on this outcome near term?
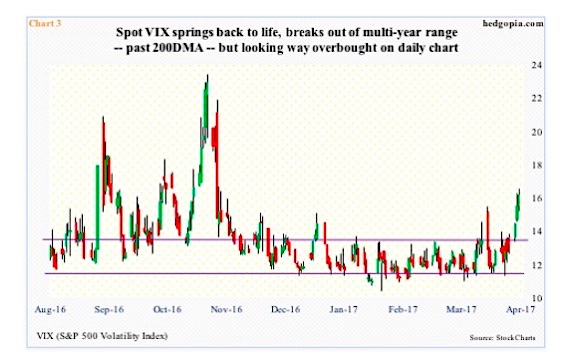
Thus far, VIX has had a healthy rally – up five-plus points in the last six sessions from low to high. It also rallied above the 200-day moving average and past a multi-year range (see chart 3 below). That said, the S&P 500 has handled this well – down 2.3 percent from the March 1st peak.
On the daily chart, Volatility Index (VIX) is now beginning to look extended, having closed above the sharply-rising upper Bollinger band for three sessions in a row.
So unless the S&P 500 loses the afore-mentioned support and the 10 year falls out of its range, it is time to be on the lookout for a spike reversal in VIX.
Several times in the past, such reversals have marked a near-term bottom in stocks. Should one occur, there is plenty of unwinding left to be done.
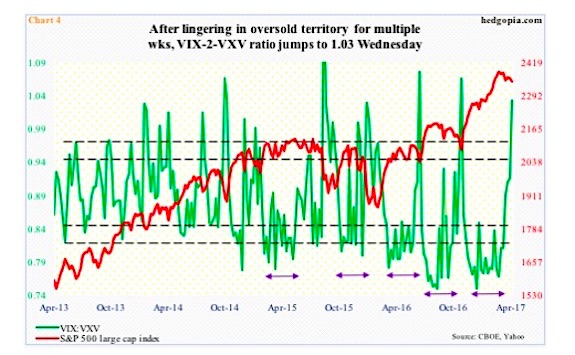
The VIX-to-VXV ratio Wednesday jumped to 1.03 – well into overbought territory. Note the VXV measures 3 month volatility (INDEXCBOE:VXV).
Interestingly, VXST, which is similar to VIX but measures S&P 500 implied volatility for nine days compared to VIX’s 30 days, got rejected at the 200-day Tuesday – likely markets’ way of saying they don’t expect a spike in volatility in the very near term.
Thanks for reading! Get more research and ideas over at my website hedgopia.
Twitter: @hedgopia
Author may hold a position in mentioned securities at the time of publication. Any opinions expressed herein are solely those of the author, and do not in any way represent the views or opinions of any other person or entity.


