THE BIG PICTURE
Week 13 is in the books and with it Q1 now rolls into Q2 for the markets. After a (failed) gap down to start the week, the stock market indices regained their footing and ended the week strong.
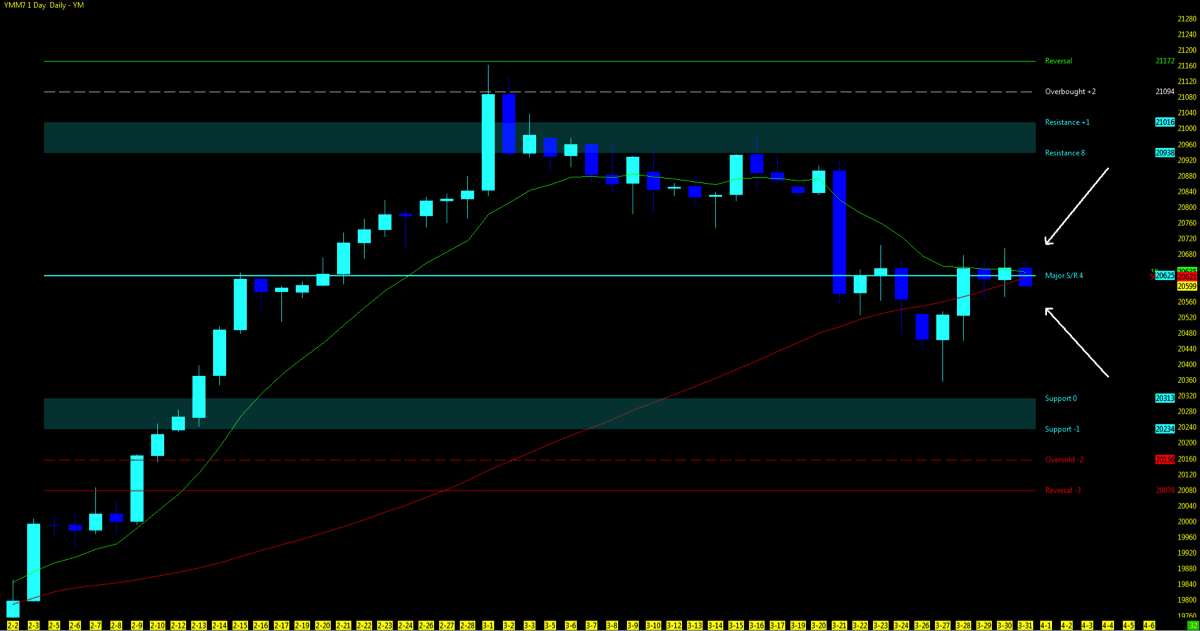
The rally allowed the S&P 500 (INDEXSP:.INX) and Nasdaq (INDEXNASDAQ:.IXIC) to remain in an ongoing uptrend holding above each indices 50/144 ema and key moving averages (50, 200) on higher time frames. Currently, the S&P 500 futures (ES) and Nasdaq futures (NQ) are back above their perspective 10 day moving averages with the struggling Dow Jones Futures (YM) right at the daily 10/50 and MML major support and resistance (see chart below).
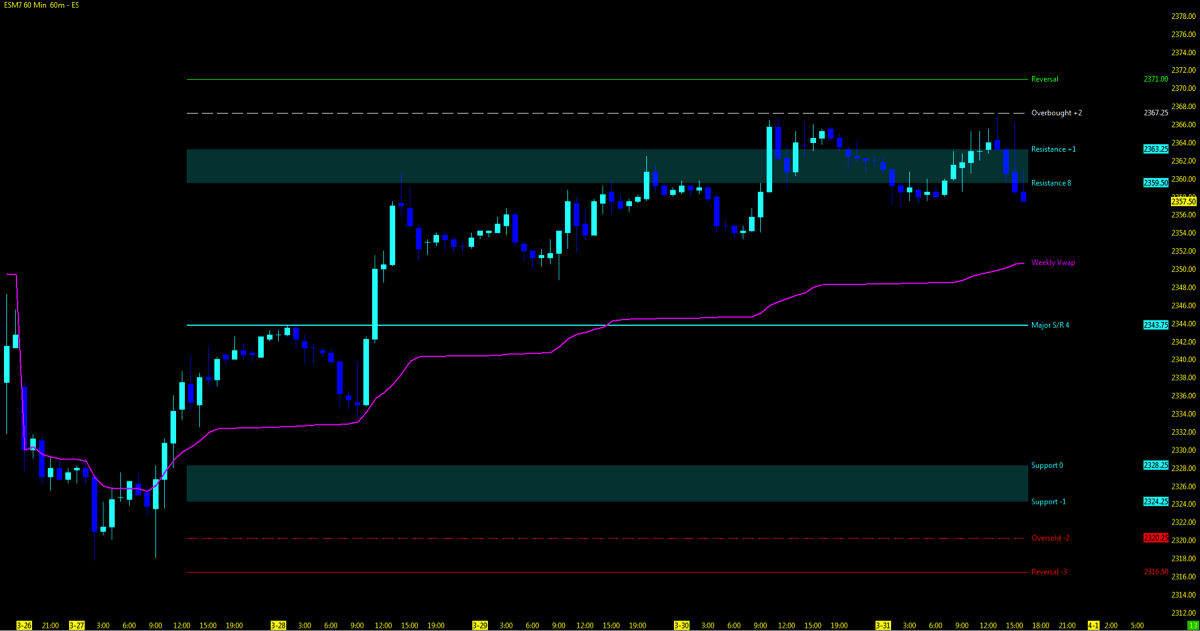
The S&P 500 futures (ES), which worked it’s way from the MML lows to highs throughout the week, is holding above the weekly VWAP on an hourly chart. It found consolidation during the later part of week on low volume, and this brings pause to the end of the week rally (see below).
VIX levels continue to remain low swinging between 11 – 13. Rumors of the health care vote back in play and upcoming tax reform/infrastructure spending have yet to be seen. Unless something significant comes out of these economic headliners, price action may struggle at these levels. I remain focused at current levels, trying to tune out the plethora of naysayers and permabears that continue to plague social media with doomsday comments. At some point the indices will have to pull back and fill the open gaps that remain open below. Note that you can read more about my trend trading strategies on my website.
Key events in the market this week include FOMC minutes on Wednesday as the market continues to ponder the amount of rate hikes to come in 2017 and Friday’s non-farm payroll numbers. Federal reserve speakers which surely can move the market on any given day are spread throughout the week. Core Economic earnings for Q1 starts to role out for the next 6 weeks, surely an indicator if the numbers are that great, which can also be smoke and mirrors at times. Don’t forget Washington politics and worldly imbalance to set the market in motion which by any other given year may be not be as newsworthy but continue to be playing a bigger role in 2017 as we have seen since Q4 of 2016.
…and last, the APRIL showers which by history tend to bring a bullish sentiment to the market has yet to be seen. Keep in mind that past performance is never indicative of future price action.
The Bottom Line
Watch price action around the daily 10/50ma on the ES/YM. If unable to hold, price action may seek support around 50% pullback (MML Major S/R) and open gaps below. Upside look to regain all time highs. NQ at the highs, with positive earnings numbers mid month will plow higher and until then, watch the 10dma for downside trend break and 50ma for support.
Technical momentum probability REMAINS in an UPTREND on the bigger picture. Signs of market weakness started to show in week 11 and 12 with a push back upside in week 13. Observe the intraday on the 60/15m charts for any alert of the change in trend or continued movement upside. Keep a weekly VWAP on the 60m chart to monitor trend change. I will continue notify through social media and my daily outlook; posted 15 minutes prior to the US open of any updates throughout the week.
Note that you can also view my market outlook on YouTube. Markets Covered: ES, YM, NQ, GC, CL
Attempting to determine which way a market will go on any given day is merely a guess in which some will get it right and some will get it wrong. Being prepared in either direction intraday for the strongest probable trend is by plotting your longer term charts and utilizing an indicator of choice on the lower time frame to identify the setup and remaining in the trade that much longer. Any chart posted here is merely a snapshot of current technical momentum and not indicative of where price may lead forward.
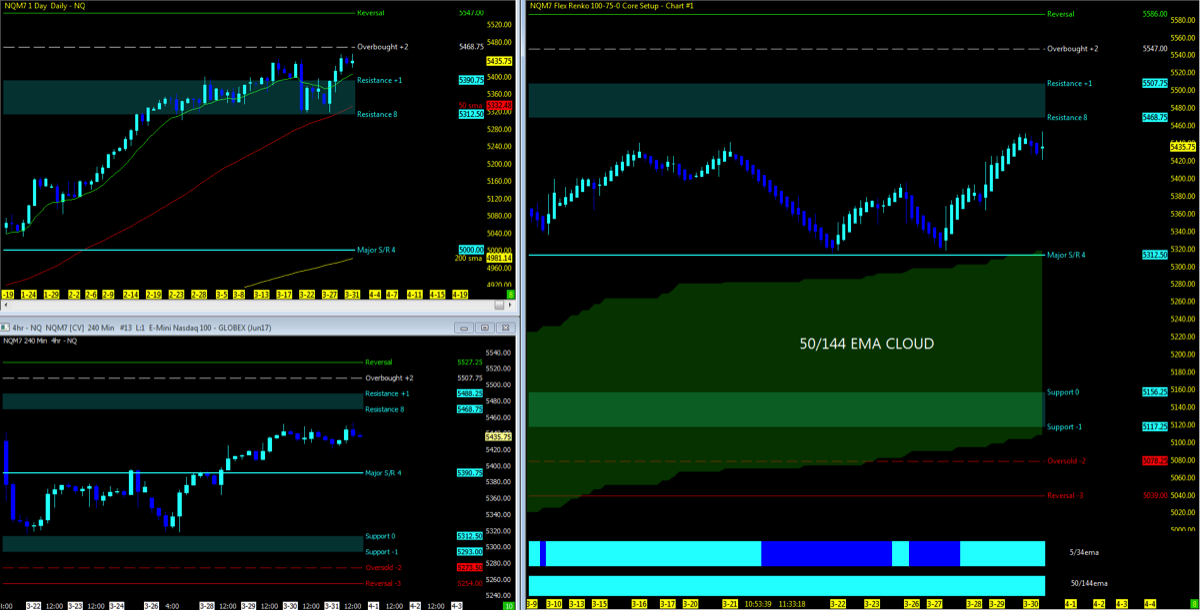
NQ – Nasdaq Futures
Technical Momentum: UPTREND
Using the Murray Math Level (MML) charts on higher time frames can be a useful market internal tool as price action moves amongst fractal levels from hourly to daily charts. Confluence of levels may be levels of support/resistance or opportunities for a breakout move. Charts below: Daily; Range; 4hr
Nearest Open Daily Gap: 5232.5
Lowest Open Gap: 4017
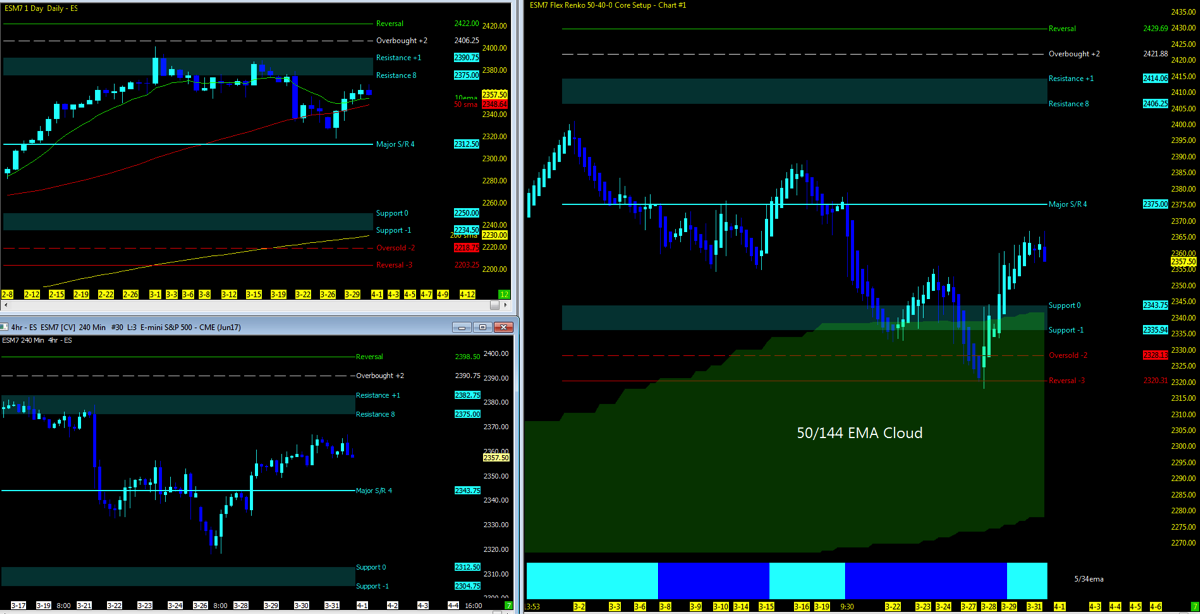
ES – S&P 500 Futures
Technical Momentum: UPTREND
Nearest Open Daily Gap: 2315.75
Lowest Open Gap: 1860.75
Thanks for reading and remember to always use a stop at/around key technical trend levels.
Twitter: @TradingFibz
The author trades futures intraday and may have a position in the mentioned securities at the time of publication. Any opinions expressed herein are solely those of the author, and do not in any way represent the views or opinions of any other person or entity.

: Creating Bullish Divergence?")

: Creating Bullish Divergence?")


