Soybean farmers have been hit hard in 2018!
Perhaps this weekends dinner between POTUS and Xi will change things?
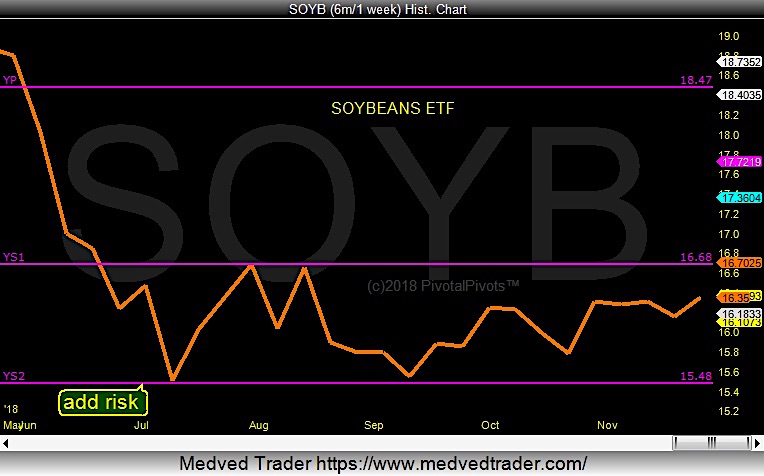
Let’s look at a price chart with a specific eye on the yearly pivots.
Soybeans (NYSEARCA: SOYB) have been consolidating for the last several months between the Yearly S1 (Ys1) and the Yearly S2 (Ys2) pivot points.
A breakout above the Ys1 price pivot could open the door for a fast run to the Yearly Pivot (YP) at $18.47.
Stay tuned… soybeans may be ready to move.
Soybeans Chart with Yearly Pivots
To learn more about yearly pivot points, please check out my “Using multiple pivot points for trading opportunities” webinar.
Twitter: @Pivotal_Pivots
The author may have a position in mentioned securities at the time of publication. Any opinions expressed herein are solely those of the author, and do not in any way represent the views or opinions of any other person or entity.


