Solar stocks tend to be dominated by Tesla (TSLA) and First Solar (FSLR).
But if we simply look at the key solar sector ETF (TAN) then we will realize that the sector at large is trading at a tough intersection.
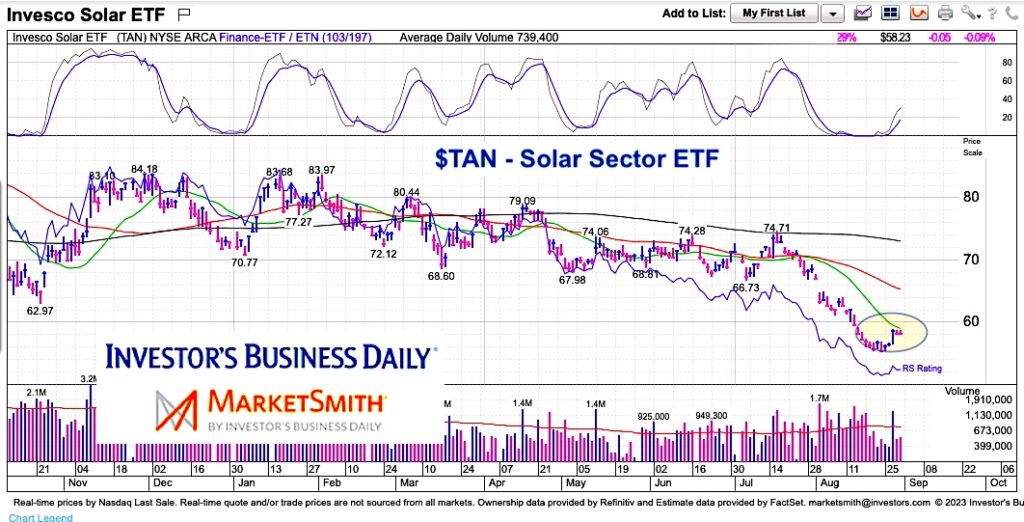
TAN is attempting to rally but trading into resistance at its falling 20-day moving average. Though the overall trend is bearish, there is a chance that price breaks out here and gears up for a test of the 50-day moving average. Either way, traders can use the 20-day moving average as a guidepost within a broader bearish context.
Note that the following MarketSmith charts are built with Investors Business Daily’s product suite.
I am an Investors Business Daily (IBD) partner and promote the use of their products. The entire platform offers a good mix of tools, education, and technical and fundamental data.
$TAN Solar Sector ETF “daily” Chart
As mentioned, price is testing the 20-day moving average. A move above it would likely see a trip to the 50-day moving average. The 50-day is near the recent gap lower and will be significant resistance should price break above the 20-day.
Twitter: @andrewnyquist
The author may have a position in mentioned securities at the time of publication. Any opinions expressed herein are solely those of the author, and do not in any way represent the views or opinions of any other person or entity.

: Worrisome to Broader Market?")


