Unless you live under a rock, odds are high that you are well aware that its been a rough year for the small caps. The Russell 2000 (RUT), the major index for small caps stocks, has been under performing all year. And to top it off, it’s lead the market lower. So is a rally in the Small Caps overdue?
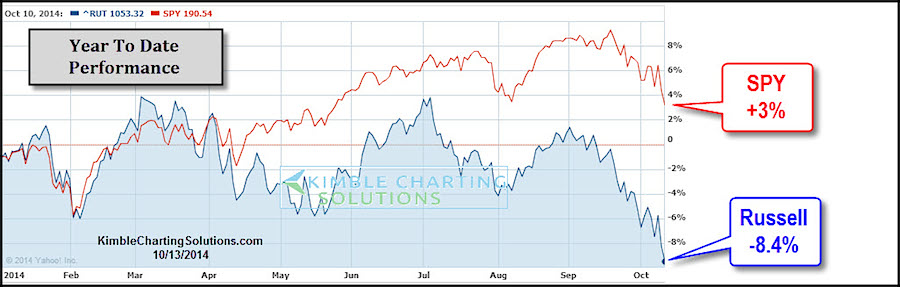
The chart below reflects that the Russell 2000 has lagged the S&P 500 by over 11% YTD. Investors don’t see this very often!
Russell 2000 versus SPDR S&P 500 (SPY) Chart
The chart below, is the ratio of the Russell 2000 to the S&P 500 over the past 10 years. As you can see, the ratio is at the lower trend line and very oversold. Could this trigger a rally?
RUT : SPY Ratio Chart (10 Year)
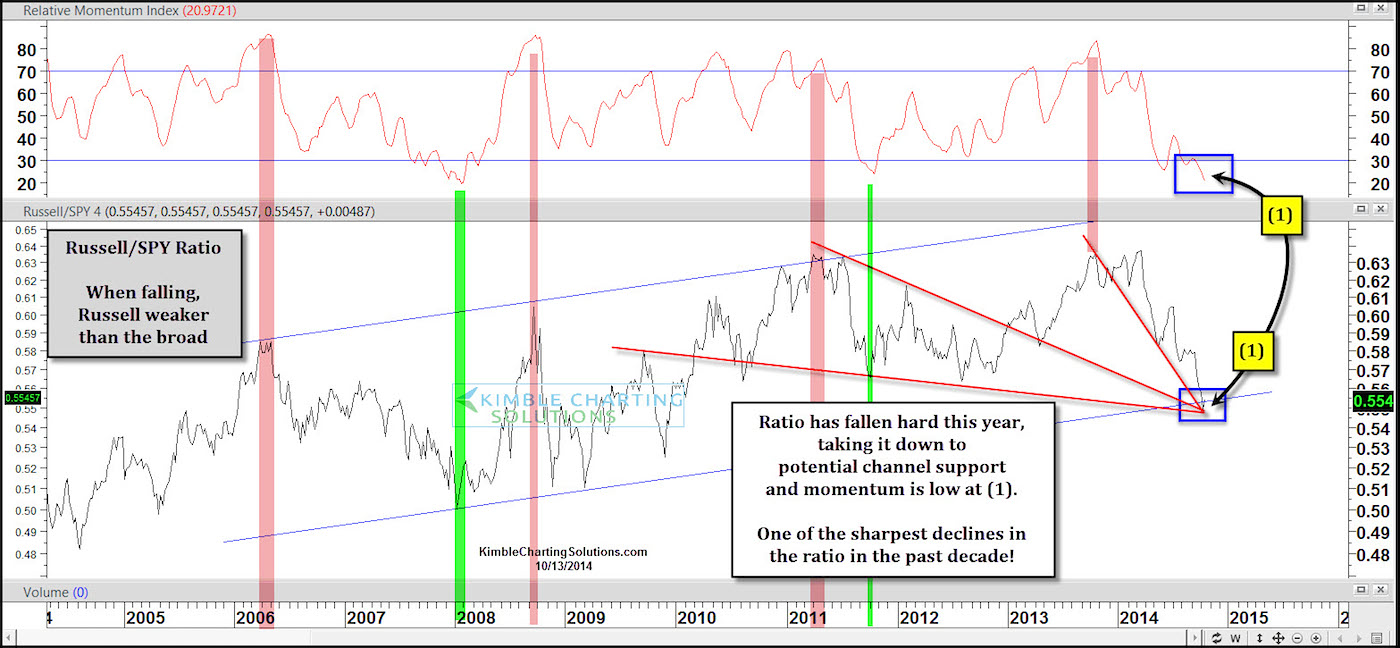
This chart highlights that the Russell 2000/SPY ratio has had one of the steepest one year declines in the past decade. The decline has taken this ratio down to potential support and momentum is over sold.
This situation reflects that the year long drastic under performance by small caps to S&P could be about to slow or even change trend.
Stay tuned….what happens here could have a great deal to do with portfolio construction.
This ratio 9 months ago suggested the pair trade would be to short small caps and long the broad market. Now this situation suggests the time could be near to do the opposite.
Follow Chris on Twitter: @KimbleCharting
No position in any of the mentioned securities at the time of publication. Any opinions expressed herein are solely those of the author, and do not in any way represent the views or opinions of any other person or entity.


