Green Fridays in 2013: it’s a very familiar refrain. The S&P 500 (SPX) notched another closing all-time high Friday – closing up 33 of 50 Friday sessions in 2013 – t0 1818.32, +8.71 or 0.48%.
This Friday, though, was all about the Russell 2000. The small cap index’s benchmark (RUT) also closed at a new all-time high at 1146.47, +21.02 or 1.87%. Talk about some bottom-up relative strength across market caps!
While the wide disparity in performance is a bit surprising (especially after yesterday’s laggard performance), the gain itself isn’t. The Russell has been working from a very repetitive and symmetrical script (discussed at length on See It Market quite a few times since it became particularly apparent in mid-Summer) all year long. There are a few ways to frame the powerful time and price symmetry that evolved over the course of 2013, with the index’s reaction to its 50-Day Simple Moving Average (5oSMA) qualifying as the simplest and most effective for conversion of analysis into action.
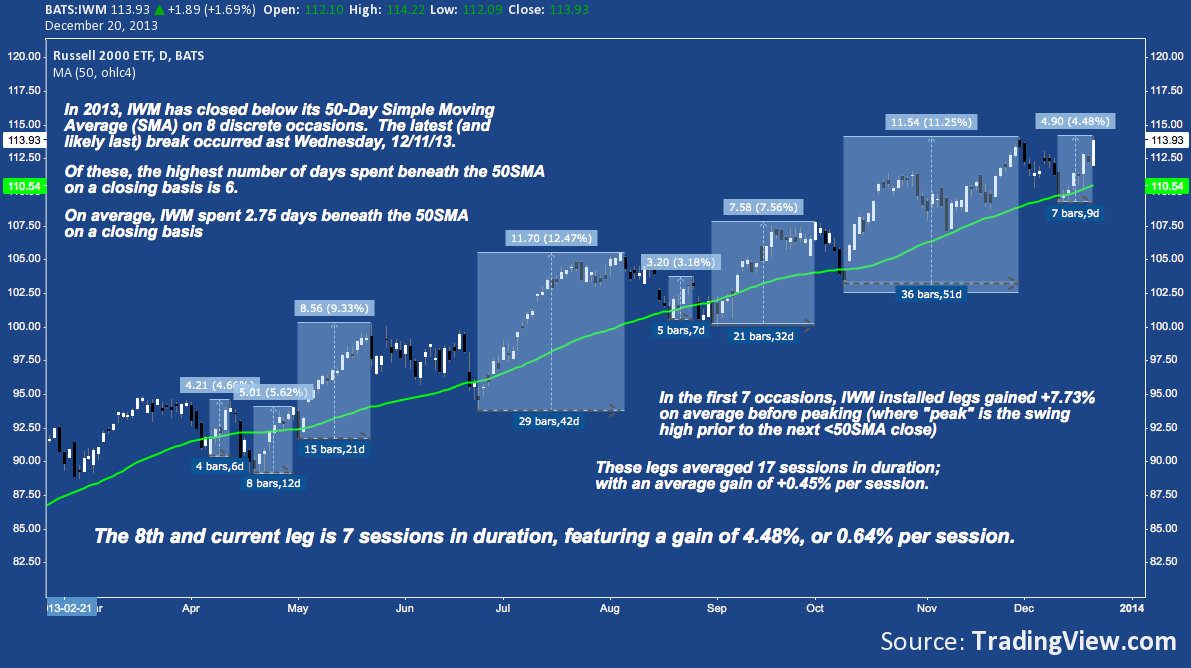
Looking at IWM (iShares’ Russell 2000 ETF), we see that the Russell 2000 has dipped beneath its 50SMA on 8 distinct occasions in 2013. The chart below describes these occurrences and what followed:
Russell 2000 iShares ETF (IWM) – Daily: 50-Day SMA and the Santa Claus Rally
It goes without saying that a Russell 2000 close below its 50SMA has been an unfailing signal (and bear trap) since April. In its latest incarnation, IWM has fallen right in-line with mid-December’s well-known positive seasonality. IWM closed beneath its 50SMA on 2 consecutive days (below the 2.75 day average) and since bottoming last Wednesday has added +4.48% in 7 sessions or 0.64% per session, massively outperforming the year’s 0.4% per session average.
Call it hindsight, but the current rally has been well-telegraphed as highly probable with a 7/7 record around the 50-Day SMA this year. Given the Russell’s structural symmetry throughout 2013, assuming “this time is different” – at any time – turned out to be tragically mistaken. Moreover, an entry on a break back above the 50SMA with a stop beneath the just-installed <50SMA low boasted a very attractive risk/reward scenario given the year’s precedent. Whether one decided to hold all the way through – once the Russell’s rising channel was established in late June, it never broke – or actively traded trend and counter-trend as I did, these pullbacks to test the 50SMA provided fantastic setups every step of the way.
The current picture for the Russell 2000 isn’t without it’s longer-term issues right now. But, looking at the next couple weeks: with the average up-leg this year lasting 17 sessions and advancing a cumulative +7.73%, the already-begun Santa Claus Rally at 4.48% and 7 sessions may yet have some room to run into Christmas and the end of an already historic year.
Twitter: @andrewunknown and @seeitmarket
Author net short Russell 2000 at the time of publication.
Santa Claus image courtesy of Investorplace.
Any opinions expressed herein are solely those of the author, and do not in any way represent the views or opinions of any other person or entity.


