The broader stock market is turning sharply lower to begin the week.
First it was the lagging large cap stocks…
And now it is the small cap stocks turn. The timing is impeccable.
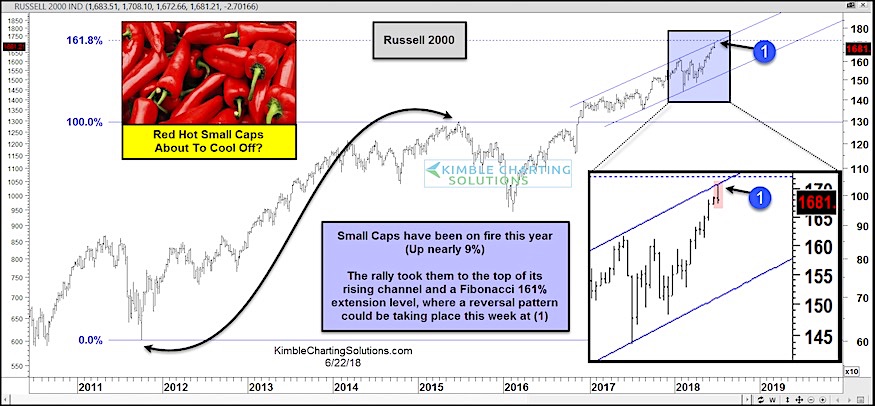
Looking at the chart below, you can see the widely followed Russell 2000 small caps index is testing overhead trend line resistance… and reversing lower.
The rally took the Russell 2000 to the top of the rising channel (last week)… this resulted in a potential reversal pattern as they closed the week well off the highs. And with today’s push lower, things are looking shaky.
As well, the upper trend line resistance coincides with the 161.8% Fibonacci extension level. Careful here!
Russell 2000 “Weekly” Chart – reversal in motion?
Note that KimbleCharting is offering a 30 day Free trial to See It Market readers. Just send me an email to services@kimblechartingsolutions.com for details to get set up.
Twitter: @KimbleCharting
Any opinions expressed herein are solely those of the author, and do not in any way represent the views or opinions of any other person or entity.


