Tonight, I depart from the Economic Modern Family of stock market ETFs.
However, do not forget that they are very mixed and in extreme disharmony.
Today, thought, we are going to look at a different family struggle: Gold, silver and precious metals.
More specifically, we’ll look at the silver to gold ratio.
The top chart is silver prices.
The bottom chart is the silver to gold ratio.
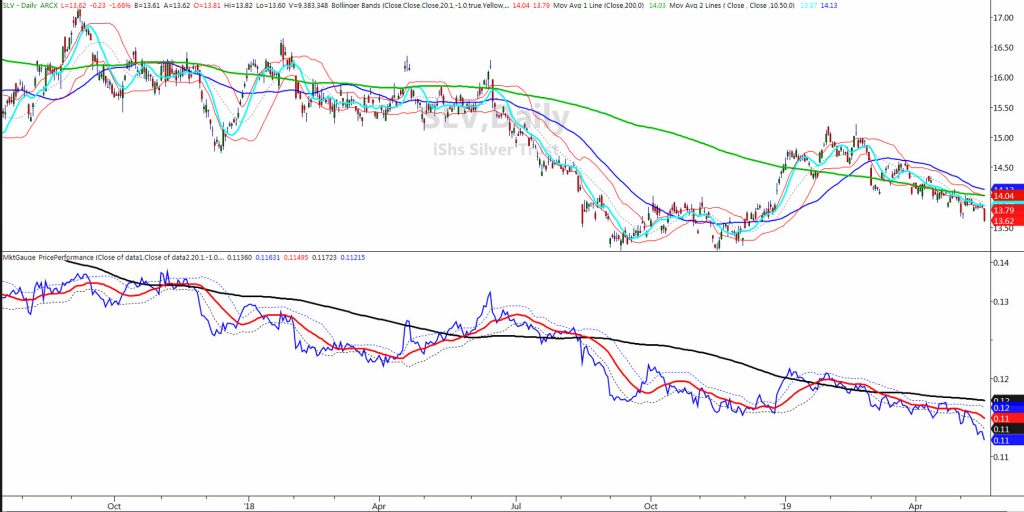
On the gold to silver ratio chart, the blue line is the actual ratio.
The red line is the 20-DMA of the ratio. The black is 125 days or the 125-DMA.
The dotted lines are Bollinger Bands.
What does this look like to you?
If you are thinking that any bullish talk about the precious metals is premature and inaccurate, give yourself a gold star!
Today, the blue line (gold to silver ratio) turned down and moved further away from the moving averages.
If we look at this ratio as a signal for inflationary pressures or as a hedge against any impending crises, then surely both metals are heavily sedated.
The Bollinger Bands indicate that the ratio could be getting oversold.
Yet, until that ratio flips and the blue line crosses the BB and then the red or 20-DMA, a starter position long is appropriate.
Should the ratio clear the black line, most likely it will accompany some watershed event-war, fear of inflation, a Fed rate cut, etc.
With the equity market in disarray and the metals weak, finding pockets of strength that are more than one-day wonders, is not so easy right now.
Reminder: Most of my work comes from the Economic Modern Family and Market Phases. All of this is covered in my new book – Plant Your Money Tree: A Guide to Growing Your Wealth!dsfaf
You can order the book here and receive a special $97 bonus for free while it lasts!
S&P 500 (SPY) – Back to an unconfirmed bullish phase. 286.13 is the 50-DMA to hold or not.
Russell 2000 (IWM) – 154.50 and below is not a good sign. Granddad is tired.
Dow Jones Industrials (DIA) – Could not clear the 50-DMA even with the Boeing rally.
Nasdaq (QQQ) – The 50-DMA is at 183.26 now pivotal.
KRE (Regional Banks) – 54.20 resistance with this in a confirmed bearish phase. 51.31 the 200-WMA.
SMH (Semiconductors) – Confirmed caution phase. Inside day too-so under 106.66 trouble.
IYT (Transportation) – Unconfirmed Bullish with 189.37 the support this must hold.
IBB (Biotechnology) – 105 resistance, 103.36 the 200 WMA that must hold.
XRT (Retail) – Under 42.12 expect more weakness.
Twitter: @marketminute
The author may have a position in the mentioned securities at the time of publication. Any opinions expressed herein are solely those of the author, and do not in any way represent the views or opinions of any other person or entity.

 Testing Important Price Support")
: Cup (and Maybe Handle) Watch")

