Silver (SLV) to Gold (GLD) Price Ratio Chart
For the first 4 months of this year (2020), Gold was the only bullish story in the precious metals sector.
But come May, Silver began to perk up. And since then, Silver prices have been on a tear.
In today’s chart, we look at the ratio of Silver (SLV) to Gold (GLD) and why this important ratio should be on your radar.
In general, Gold can operate on its own and is a followed fixture in the investment world. That said, when Silver joins the party it tends to be a good sign for precious metals bulls as it portrays demand for the entire sector in general.
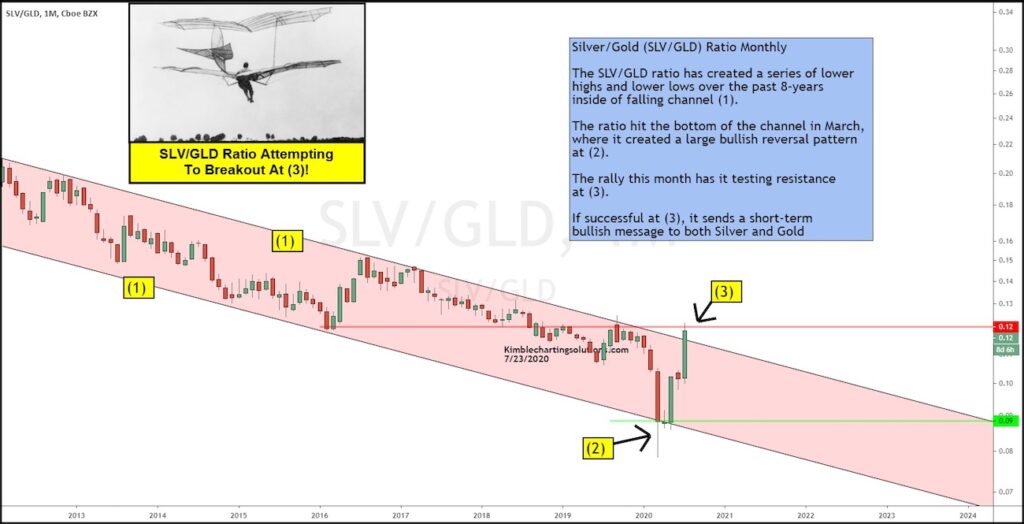
Breakout or Peak at Key Resistance?
This ratio is nearing an important time and price juncture. For the past several months (and years), the SLV/GLD ratio has been in a falling trend channel marked by each (1). This means Silver (SLV) is underperforming Gold (GLD).
Could this dynamic be changing? As you can see in today’s chart, the ratio hit the bottom of the channel in March and formed a large bullish reversal pattern at (2). The rally this month has it testing resistance at (3)
If the SLV/GLD ratio can breakout over resistance it will send a bullish near-term message to both Silver and Gold. Stay tuned!
Note that KimbleCharting is offering a 2 week Free trial to See It Market readers. Just send me an email to services@kimblechartingsolutions.com for details to get set up.
Twitter: @KimbleCharting
Any opinions expressed herein are solely those of the author, and do not in any way represent the views or opinions of any other person or entity.


: Showing Some Signs of Emerging Strength")
