While many point to the Federal Reserve as the tide that raises all ships, the boats carrying commodities have all but sank over the last couple of years. Silver prices have fallen nearly 30% since it’s 2014 high alone and made a series of lower highs and lower lows.
It’s hard to argue against the notion that Silver is in a bear market as each rally gets faded. We can also see signs of this bear market in momentum, with each march higher hitting a brick wall at the upper end of a bearish range.
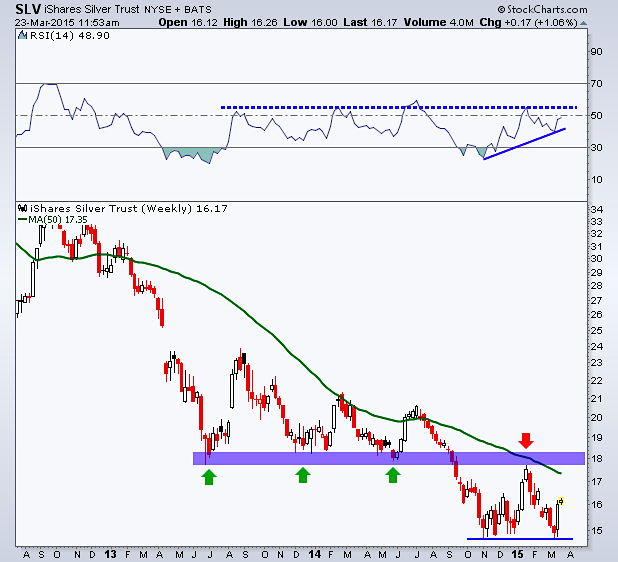
Below is a weekly chart of the iShares Silver Trust ETF (SLV) going back to late 2012. After a large drop in 2012 and 2013 silver prices began to consolidate at created support near $18.
However, each rally was unable to get back above the 50-week Moving Average and momentum began defining the range for which it would eventually remain for the coming year. After multiple tests of the support at $18, price eventually broke through and tagged $15 for this ETF. As with many levels of support, once it breaks it often becomes resistance. Which is what we can see took place at the start of this year when Silver bulls tried to gain the majority. But they were unable to get the popular opinion and price failed at $18 and again was unable to break the 50-week MA.
Now with price re-testing $15 for SLV we have a bullish divergence in the Relative Strength Index (RSI). We saw a similar divergence in June of last year before small rallies took place but ultimately failed. With the RSI making a higher low as price tests a prior low, this a potentially positive sign that price may begin to rally. What’s important to understand with this chart is the defined level of resistance in momentum. The bearish range that the RSI is in has put a quick end to any attempt to see price appreciate and we’ve yet to see the indicator break above this level yet.
Going forward I’ll be watching if the RSI can get materially above 50 and if price can once again break above $18 as well as its 50-week MA. This will likely not be an easy feat for Silver bulls to take on, but it’s important to know where ‘price memory’ is and the levels to keep an eye on.
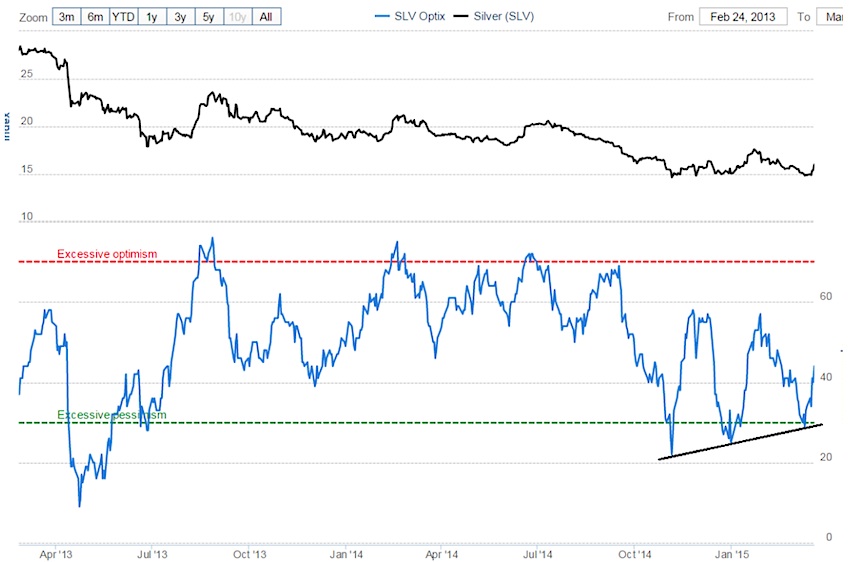
A second chart of Silver I want to take look at involves Sentiment. The chart below comes from SentimentTrader.com and is a proprietary mix of various sets of sentiment-related data. As Silver consolidates near $15 I find it interesting to see sentiment begin to put in a series of higher lows from what is deemed an “excessive pessimism” level. Each test of this level in price has been accompanied by, what appears to be, less and less bearish sentiment. This may help give some self-esteem to the bulls as their camp begins to grow in attendance.
Prior rallies from $15 in SLV have seen sentiment stop out around 60. So if we do see Silver prices rally I’ll be watching to see if sentiment can break out above these two prior highs as a possible sign that a shift is taking place in the Silver market.
Thanks for reading.
The information contained in this article should not be construed as investment advice, research, or an offer to buy or sell securities. Everything written here is meant for educational and entertainment purposes only. I or my affiliates may hold positions in securities mentioned.
Follow Andrew on Twitter: @AndrewThrasher
Read more from Andrew on his Blog.
Any opinions expressed herein are solely those of the author, and do not in any way represent the views or opinions of any other person or entity.


