Silver has been red-hot this year, nearly hitting $40 recently.
But price action doesn’t move in a straight line. Silver has pulled back over the past week and is nearing a very interesting point in time and price.
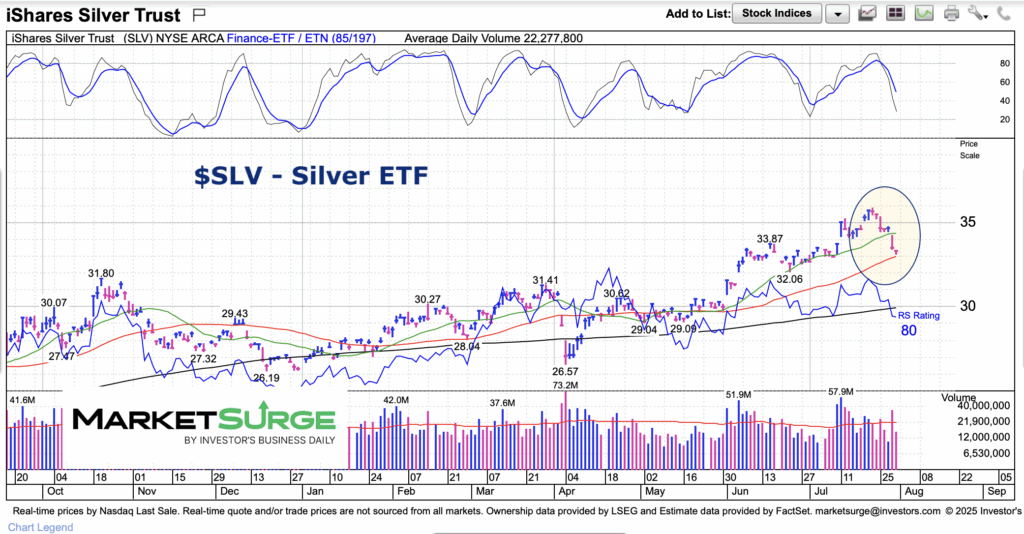
Today we look at Silver through the Silver ETF (SLV).
Price is sitting on an important moving average that may determine if the recent pullback is about to end… or is just getting started.
Note that the following MarketSurge charts are built with Investors Business Daily’s product suite.
I am an Investors Business Daily (IBD) partner and promote the use of their products. The entire platform offers a good mix of tools, education, and technical and fundamental data.
$SLV Silver ETF Chart
Looking at the chart, we can see how quickly SLV rolled over. It fell through its 20-day moving average and right to its 50-day moving average. We should see some sort of support here but cannot rule out a deeper correction if this gives way.
That said, all three major moving averages are rising so I’d like to think the $31-$32 price area would be supportive (if we get there). This marks the October and March highs, as well as the early June price gap.
Twitter: @andrewnyquist
The author may have a position in mentioned securities at the time of publication. Any opinions expressed herein are solely those of the author, and do not in any way represent the views or opinions of any other person or entity.


