The most important technical indicator I use is price itself, as it’s a visual representation of the collective sentiment of investors.
Market breadth can provide a fantastic second-level indication, giving some additional color below the price itself.
One stock market breadth indicator worth following is close to flagging a key bearish signal.
Here we present the S&P 500 Index INDEXSP: .INX with 50-day and 200-day moving averages, along with the percent of S&P stocks trading above the 200-day moving average as well as the percent that are above the 50-day moving averages.
S&P 500 w/ Stock Market Breadth Indicators
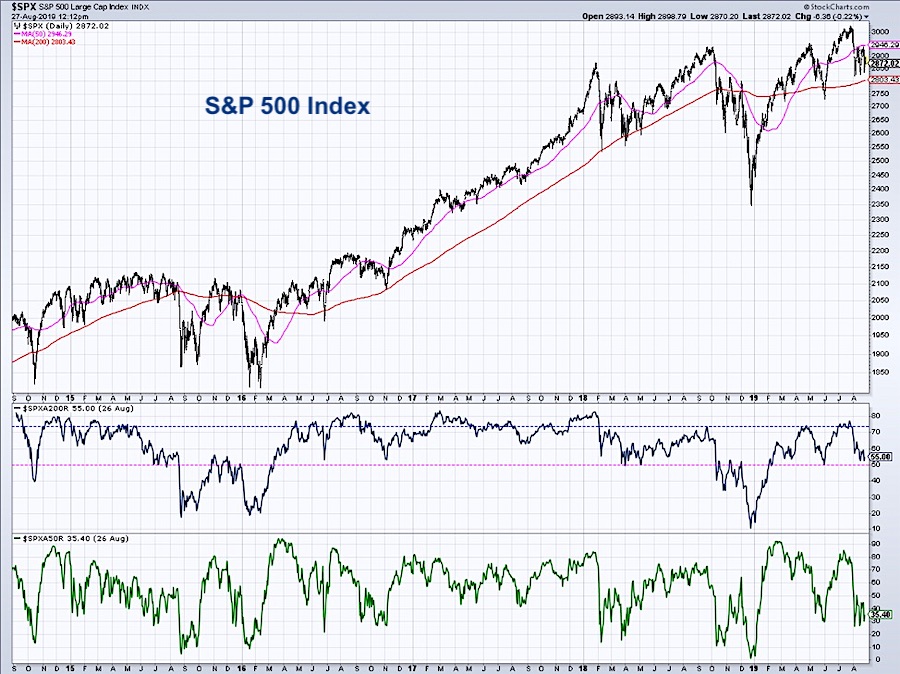
First let’s look at the percent of stocks above their 50-day moving average, indicated by the bottom series on the chart. You’ll see that when the market was moving to new highs in July, this indicator peaked at around 85%. In the last month, this has changed to where only 35% of S&P 500 stocks are above their 50-day moving average.
This suggests that literally half of the S&P 500 members have broken down through this key short-term trend barometer.
Now let’s review the more important of the two for long-term investors, the percent of stocks above their 200-day moving average.
This breadth measure peaked around 75% in mid-July and has since corrected to around 55%. So over half of the S&P names remain above their 200-day moving averages. Fairly constructive!
The pink horizontal line indicates the key 50% level for this indicator. As long as over 50% of S&P stocks remain above their 200-day moving average, for example in May 2019 and April 2018, the market has continued on to higher highs.
But in the cases where this indicator has broken below 50%, in October 2018 and August 2015, the market has floundered for much longer.
With the recent market correction, the percent of stocks above their 200-day moving average has remained above this important 50% level. If and when this breadth measure breaks below 50%, this would suggest a much higher risk for further downside.
Twitter: @DKellerCMT
The author does not have a position in mentioned securities at the time of publication. Any opinions expressed herein are solely those of the author, and do not in any way represent the views or opinions of any other person or entity.


