The long term or secular reasons to have an emerging market (EM, or developing market, if you prefer) allocation within a portfolio are pretty sound. We’ve likely heard them all before: the demographics are better, the economic growth is faster, and both equity and debt offer a different risk/return profile compared with developed markets.
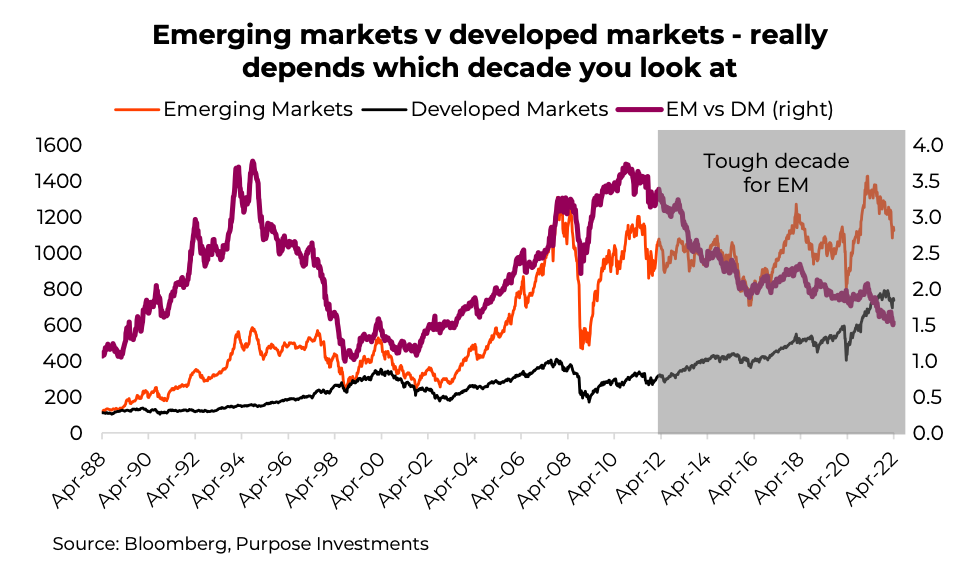
Unfortunately, over the past decade, that different risk/return profile of EM equities has resulted in muted returns with lots of risk. During that time, EM equities have grown at about 4% compared with almost 12% for global developed markets (DMs).
Truth be told, if you looked at the decade before the last decade it was literally the opposite story. EMs crushed it in the early 2000s compared with DMs. So, what does the next decade hold, or even the next few quarters or years?
Some good, some bad
Historically, much of the relative performance of EMs can be explained by several key macro factors. In this section, we will go through a few of them, including expectations on the next move.
Valuations (good) – It is more common for EMs to trade at a valuation discount to DMs. The risks are greater from a currency, political, growth-sensitivity, and/or flows perspective. That being said, with DMs trading at 17.2x forward estimates and EM trading at 11.8x, the spread is higher than historical norms.
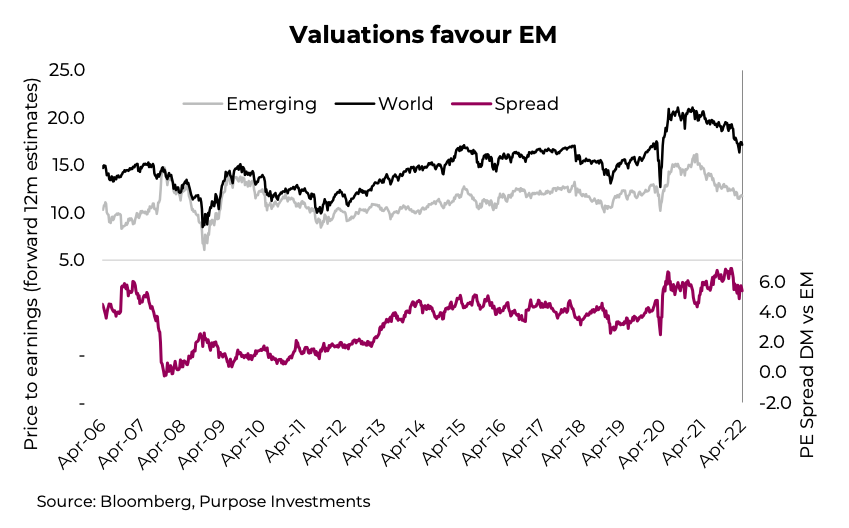
To add some context, the valuations between EMs and DMs were almost equal from 2007 to 2010, during the final stages of the commodity super cycle. So, with commodity prices just about as elevated today, why has the valuation spread not narrowed? Well, EM is now more China and technology tilted than 15 years ago and much less commodity sensitive. Still, that is a spread that supports looking at EM.
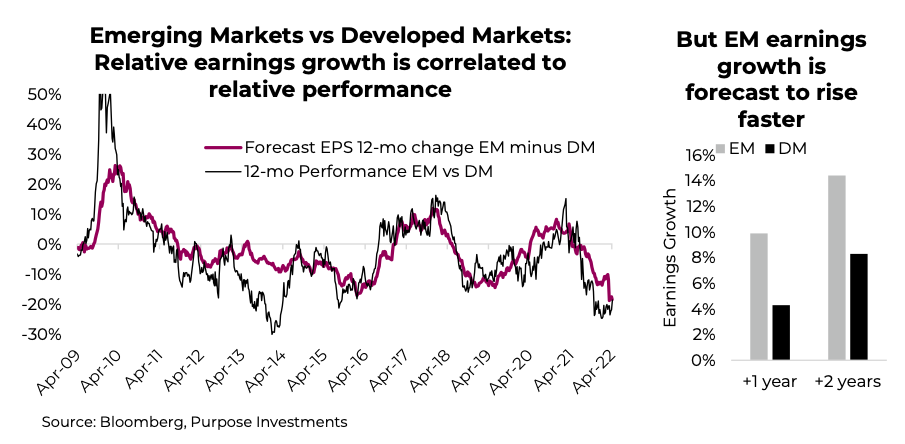
Earnings growth (good) – When earnings growth is strong, and rising faster in EMs than DMs, EMs tend to outperform. When earnings growth slows or becomes negative, DMs perform better. In a world where there is lots of earnings, risk appetites tend to be greater, and this helps EMs. When earnings growth is scarce, there is greater safety in DMs.
This explains much of the underperformance of EMs over the past decade as earnings growth in DMs has simply been stronger. You can see this in the following graph as the purple line is below zero for much of the period. However, based on current consensus estimates, EM earnings growth is now poised to surpass DM earnings growth, which has been slowing. In the next 12 months, EM earnings growth is forecast at about 10% compared with only 4% for DMs. This does favor EMs.
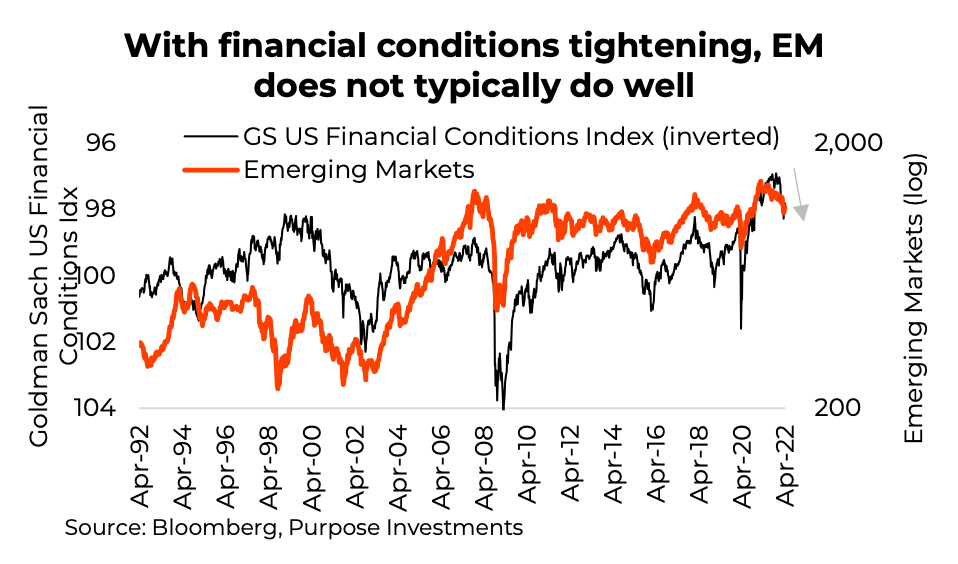
Financial conditions (bad) – When the world is experiencing tightening financial conditions, EMs tend to suffer more. There is a decent relationship between relative EM and DM performance and U.S. yields, the direction of Fed policy, and the direction of the U.S. dollar. Or we can use the Goldman Sachs US Financial Conditions Index as a proxy of many factors. This is not relative performance to DMs, it is outright EM performance.
Given the Fed is on the path to raise rates, yields have moved higher, and quantitative easing (QE) is giving way to quantitative tightening, I think it is safe to say we are going to see more financial tightening in the months ahead.
Not Your Parents Emerging Markets
It is important to understand that the EM universe today is nothing like that of the 90s or even early 2000s. Countries within the universe have gone on various development paths, with different
resources and dynamics. Decades ago the space was dominated by commodity-producing nations and economies that leveraged cheap labour to make stuff for kids (that is you). Today’s EM is dominated by Asia, with a heavy technology tilt. Taiwan Semi, Tencent, Samsung, and Alibaba are the biggest names. China, Taiwan, and India comprise about two-thirds of the country allocations across most broad EM ETFs.
This changing composition may lessen some of the previously highlighted performance relationships and it certainly adds some new twists. At the moment, EM’s fate is dominated by the outlook for China. The country has cracked down on some aspects of technology and continues to suffer from the real estate fallout of Evergrande, not to mention the more immediate factor of COVID lockdowns in some regions. As goes China, so goes EM.
Investment implications
Across our multi-asset portfolios, within the equity allocation we hold between 4-5% in EMs (based on a balanced portfolio). For us, this is roughly a neutral allocation. We are encouraged by the earnings growth outlook and how beaten up the space has become. There’s still lots of political risk, especially within China, but the depressed share prices provide a level of safety. Our biggest concern is the tightening financial conditions, with a side note that perhaps this is not as strong a driver as it used to be.
Short term, we do believe tech is somewhat oversold globally. Should we get a summer bounce, this should also lift EM given its technology weight. That may create the opportunity to trim as recession risks are likely to rise as higher yields bite the global economy. Good rule of thumb: the best time to go heavy on EMs is often coming out of recessions.
Source: Charts are sourced to Bloomberg L.P., Purpose Investments Inc., and Richardson Wealth unless otherwise noted.
Twitter: @ConnectedWealth
Any opinions expressed herein are solely those of the authors, and do not in any way represent the views or opinions of any other person or entity.


