In 2022, investors watched the Federal Reserve hike interest rates very quickly. And this in turn saw bond yields move much higher.
Now in 2023, bond yields are beginning to moderate and pull back. We discussed why the odds favored a pullback on 10-year bond yields yesterday.
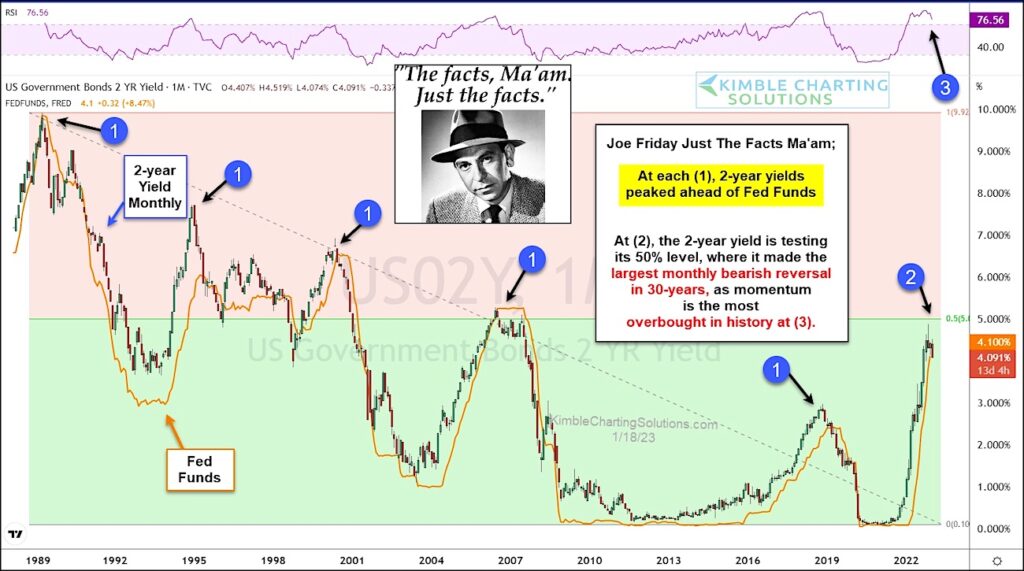
Today, we look at the “monthly” chart of the 2-year bond yield versus the Fed Funds rate. And we turn to Joe Friday for “The facts, Ma’am. Just the facts.”
As you can see, at each (1), the 2-year yield peaked ahead of Fed Funds. And it looks entirely possible that this is happening again right now!
The 2-year yield reached up to to test the 50% Fibonacci retracement level at (2) before recording the largest monthly bearish reversal in 30-years. That peak and reversal also saw momentum record its most overbought level in history at (3)!
Taken together, 2-year yields look to be suggesting a peak in fed funds has happened again. Stay tuned!
2-Year US Treasury Yield “monthly” Chart
Note that KimbleCharting is offering a 2 week Free trial to See It Market readers. Just send me an email to services@kimblechartingsolutions.com for details to get set up.
Twitter: @KimbleCharting
Any opinions expressed herein are solely those of the author, and do not in any way represent the views or opinions of any other person or entity.


