Interest rates have risen rather quickly as the Federal Reserve attempts to fight inflation.
Will the move be a case of too far, too fast?
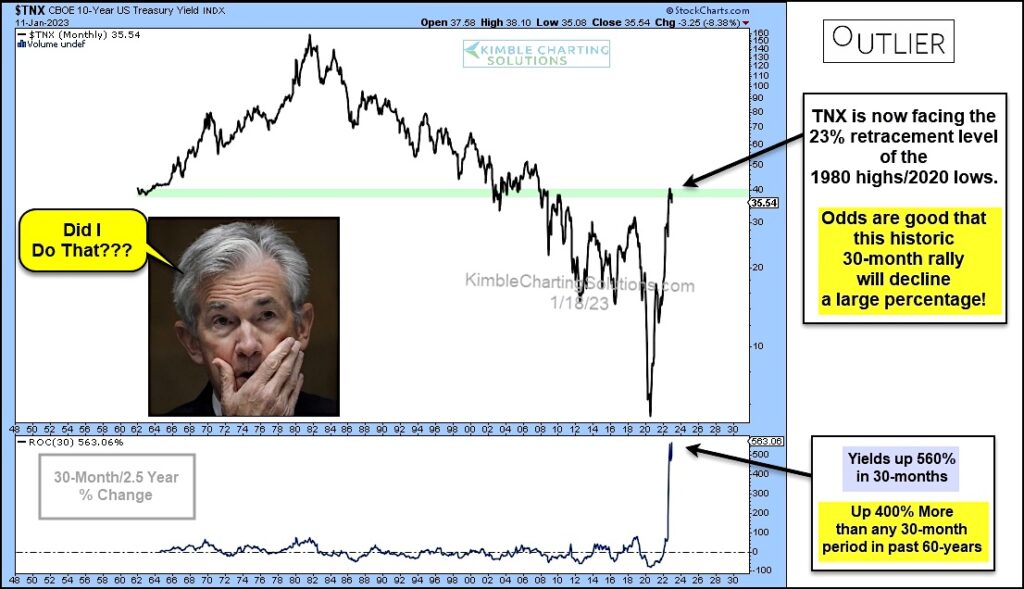
Today’s long-term “monthly” chart of the 10-year US treasury bond yield seems to think so.
In my humble opinion, the chart below puts the Federal Reserve’s 2.5 year move in perspective… and it seems to be a real outlier of the past 60-years!
As you can see, the 10-year bond yield rallied up to the 23% Fibonacci retracement level of the 1980s high/2020s low (green line). And, while doing so, it recorded a Rate-Of-Change (ROC) that we haven’t seen before: yields are up 560% in 30 months! That is up 400% more than any 30-month period in the past 60 years. Looks like it’s time for a breather…
Time will tell if the Federal Reserve rose interest rates too fast. Stay tuned!
10-Year US Treasury Yield “monthly” Chart
Note that KimbleCharting is offering a 2 week Free trial to See It Market readers. Just send me an email to services@kimblechartingsolutions.com for details to get set up.
Twitter: @KimbleCharting
Any opinions expressed herein are solely those of the author, and do not in any way represent the views or opinions of any other person or entity.

: Showing Some Signs of Emerging Strength")
