The following is a recap of the September 30 COT Report (Commitment Of Traders) released by the CFTC (Commodity Futures Trading Commission) looking at COT data and futures positions of non-commercial holdings as of September 27.
Note that the change in COT report data is week-over-week. Excerpts of this blog post originally appeared on Paban’s blog.
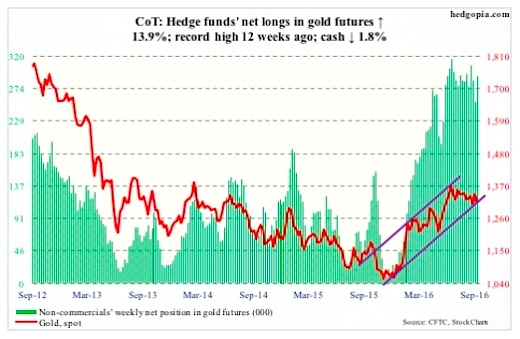
Gold: Yet another lower high since the July 6th high of $1,357.5/ounce. Spot Gold prices were also unable to save the 50-day moving average. Should Gold continue to come under pressure, the $1,300 level has provided solid support since late June this year. Below that and the bears have control.
In the week ended Wednesday, the SPDR Gold ETF (NYSEARCA:GLD) lost $77 million, after inflows of $374 million in the prior week (courtesy of ETF.com).
September 30 COT Report: Currently net long 291.9k, down 35.7k.
Crude oil: OPEC commits itself to cutting output to between 32.5 million oil barrels per day and 33 mb/d. In August, the cartel produced 33.24 mb/d. The last time the 14-member group cut production was during the financial crisis in 2008. That shows how much the oil producers, including Saudi Arabia, are hurting.
In the grand scheme of things, fundamentally this is not that big of a cut, given the prevailing oil glut. Also on Wednesday, but before the OPEC decision, the International Energy Agency said it did not see the oil market rebalancing until late 2017.
That said, OPEC’s decision speaks of the producing nations’ intent – that they are willing to compromise. Saudi Arabia in particular, which produced a record 10.673 million barrels per day in July, is capitulating. There are no details yet on how the cuts will be implemented – a potential source of discord later. Iran in particular seems to be targeting pre-sanction market share not just four mb/d.
When it is all said and done, this may prove to be a life line for U.S. shale oil, which then means glut persists, precisely what OPEC is trying to avoid. Time will tell.
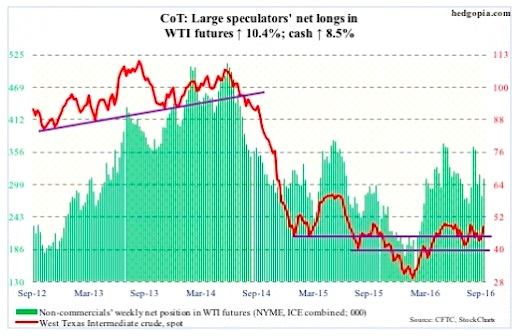
Be that as it may, it was enough of a catalyst for traders to push up spot West Texas Intermediate crude oil 5.3 percent on Wednesday – past the August 19th declining trend line – and then another 2.5 percent in the next two sessions. The 50-day moving average has been recaptured.
A bigger hurdle lies around $48/barrel, which approximates the declining trend line drawn from the May 2015 high of $62.58. The spot ended the week right on that resistance.
On a related note, mid-September short interest on XLE, the SPDR energy ETF, surged 38 percent period-over-period. These shorts probably got squeezed, leading to the 5.7-percent surge on Wednesday through Friday. The XLE Energy ETF (NYSEARCA:XLE) closed the week at $70.61 – right at resistance, which goes back to March 2011.
Trader sentiment on Wednesday was also helped by the EIA data.
In the week ended September 23, U.S. crude stocks fell by 1.9 million barrels to 502.7 million barrels – the lowest since February 5 this year.
Distillate stocks dropped by the same amount to 163.1 million barrels. The prior week was the highest since January 8 this year.
Gasoline stocks, however, rose by two million barrels to 227.2 million barrels. The prior week was the lowest since December 25 last year.
Crude imports fell by 474,000 b/d to 7.8 mb/d.
Crude production declined 15,000 b/d to 8.5 mb/d. Production peaked at 9.61 mb/d in the June 5th week last year.
Refinery utilization stood at 90.1 percent, down from 92 percent. This was a 17-week low.
September 30 COT Report: Currently net long 309.4k, up 29.3k.
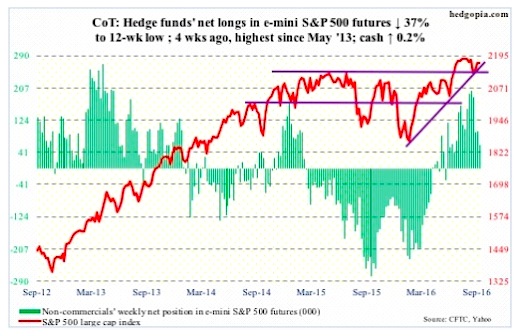
E-mini S&P 500: The S&P 500 index struggled one more time at 2175-2180… rose to 2175.3 intra-day Friday, before closing at 2168.27, literally closing at the 50-day moving average. The average is now flattish to down – potentially an important development.
In the week ended Wednesday, the SPDR S&P 500 ETF (SPY) attracted $1.7 billion, coming on the heels of outflows of $6.4 billion in the prior two (courtesy of ETF.com).
In the same week, for a change, U.S.-based equity funds attracted $622 million – the first positive week in six weeks (courtesy of Lipper). In the August 17th week, $307 million came in, but in the next five, north of $25 billion was withdrawn. Therein lies the problem. Outflows are dominant.
September 30 COT Report: Currently net long 60.1k, down 35.3k.
Thanks for reading.
Twitter: @hedgopia
Author may hold a position in mentioned securities at the time of publication. Any opinions expressed herein are solely those of the author, and do not in any way represent the views or opinions of any other person or entity.
")


