Not too long ago, we wrote about a potential cup with handle breakout for the market leading Semiconductors ETF (SMH). You can read that here.
And today we look at a “monthly” chart of $SMH to provide an update on that powerful price pattern.
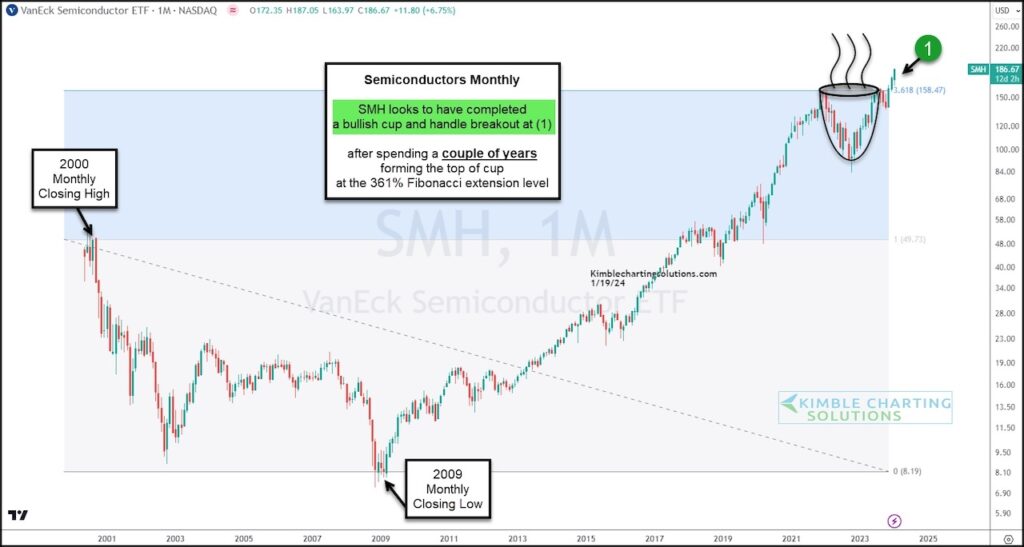
As you can see, a breakout has taken flight at (1).
The breakout looks pretty bullish, after 2-years of forming the top of the cup with handle pattern.
Note that the “handle” formed at the 361% Fibonacci extension level, highlighting the power of Fibonacci levels as well as the power of the pattern! Stay tuned!
$SMH Semiconductors Sector ETF “monthly” Chart
Note that KimbleCharting is offering a 2 week Free trial to See It Market readers. Just send me an email to services@kimblechartingsolutions.com for details to get set up.
Twitter: @KimbleCharting
The author may have a position in mentioned securities. Any opinions expressed herein are solely those of the author, and do not in any way represent the views or opinions of any other person or entity.


