As I often point out, technology stocks have been the leader of bull market since 2009. And it’s always a good idea to keep a good eye on leadership.
Within the technology sector, the Semiconductors are an area that is often out-performing. And today we highlight why active investors should be watching the Semis!
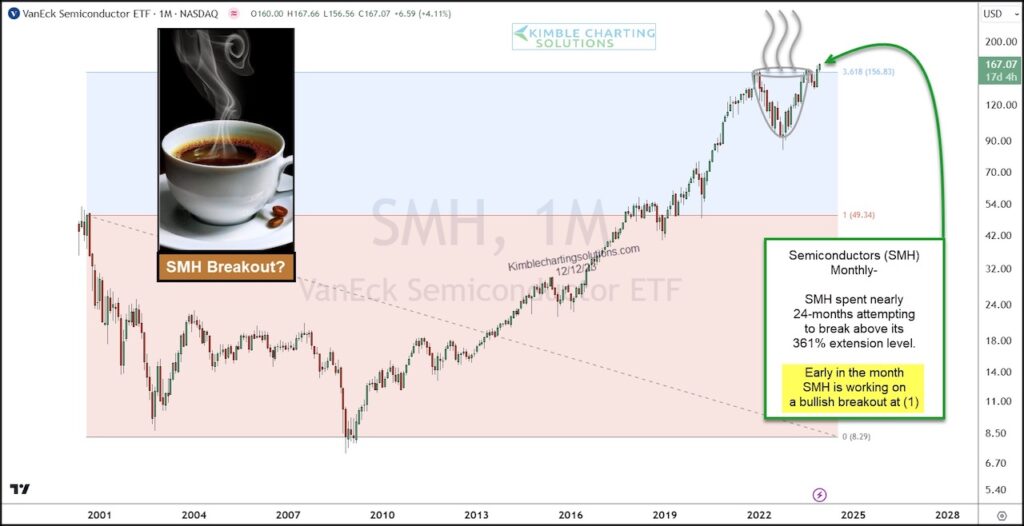
Today’s chart offers a long-term “monthly” view of the Semiconductors Sector ETF $SMH.
A few things come to mind. First, the up-trend from left to right since 2009 sticks out. Second, we’ve had a sharp decline and rally over the past two years or so. Third, this price action has created a bullish cup and handle on $SMH right at the 361% Fibonacci extension level. And it’s currently attempting to break out of this bullish price pattern.
It’s still early in the month, so we must be patient to see how $SMH closes. If it closes at or above current levels, it may be in the process of an epic breakout! Stay tuned!
$SMH Semiconductors Sector ETF “monthly” Chart
Note that KimbleCharting is offering a 2 week Free trial to See It Market readers. Just send me an email to services@kimblechartingsolutions.com for details to get set up.
Twitter: @KimbleCharting
Any opinions expressed herein are solely those of the author, and do not in any way represent the views or opinions of any other person or entity.


 Flirting With Critical Support… Again")
