We often talk about the importance of leadership in the markets. For active investors, it tells us which sectors are out-performing and warns us when those sectors begin to falter.
Today is a great example.
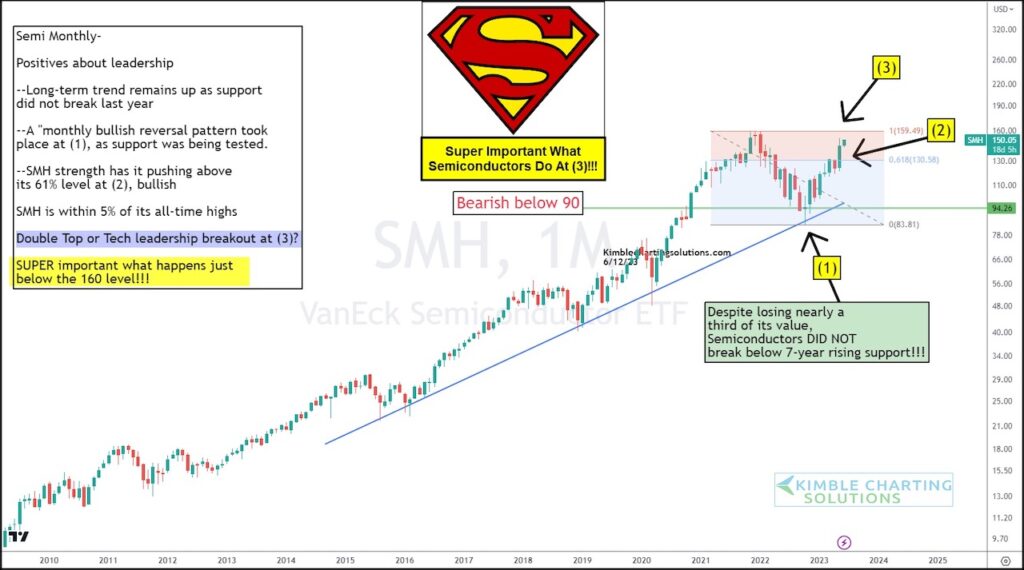
Below is a long-term “monthly” chart of the Semiconductors ETF (SMH). The semiconductors have very much been a market leader. In fact, they are the main driver of the bull market move from 2009 to 2021… and very well may be a major reason for the next bull market leg higher!
Back in 2021 to 2022, the Semiconductors (SMH) reversed lower (warning) and lost 33% of its value. But the low in 2022 had several bullish indicators. First, the long-term up-trend remained in place at (1) and turned higher on a bullish reversal pattern. Second, price momentum has pushed $SMH above the 61.8% Fibonacci resistance band at (2). And lastly, $SMH is within 5 percent of its all-time highs!
BUT we have a very big test that is about to occur at (3). The all-time highs will pose major price resistance. Seems what happens here will be very important for 2023 leadership.
Double Top resistance or tech leadership breakout? It would be SUPER bullish if a breakout takes place at (3). Stay tuned!
$SMH Semiconductors ETF “monthly” Chart
Note that KimbleCharting is offering a 2 week Free trial to See It Market readers. Just send me an email to services@kimblechartingsolutions.com for details to get set up.
Twitter: @KimbleCharting
Any opinions expressed herein are solely those of the author, and do not in any way represent the views or opinions of any other person or entity.


