Technology stocks and semiconductor stocks continue to lead the broader stock market higher. That said, the rally is getting long in the tooth.
With this in mind, I think it is especially important to follow market leaders and their current intermediate-term price patterns.
Today, we look at a “weekly” chart of the semiconductors and highlight a bullish intermediate-term pattern. While this pattern is nearing resistance (and it will likely see a pullback/consolidation), it is constructive for bulls.
Note that the following MarketSmith charts are built with Investors Business Daily’s product suite.
I am an Investors Business Daily (IBD) partner and promote the use of their products. The entire platform offers a good mix of tools, education, and technical and fundamental data.
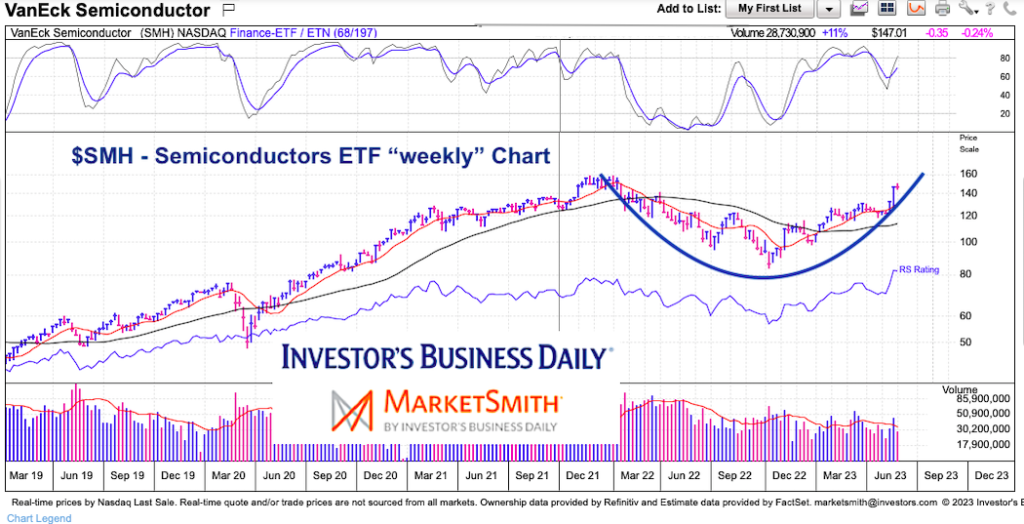
$SMH Semiconductors Sector ETF “weekly” Chart
Today’s chart is simple. As you can see, the Semiconductors (SMH) have formed a bullish “cup” pattern. As we near the top of the cup, we very well may see some consolidation or pullback. Note that a few months of consolidation could form a “handle”. Bullish traders will likely turn patient over the short-term and wait for the pattern to develop and signal a breakout to new highs.
Twitter: @andrewnyquist
The author may have a position in mentioned securities at the time of publication. Any opinions expressed herein are solely those of the author, and do not in any way represent the views or opinions of any other person or entity.

: Cup (and Maybe Handle) Watch")
 Trading Near Top Of Price Range")

