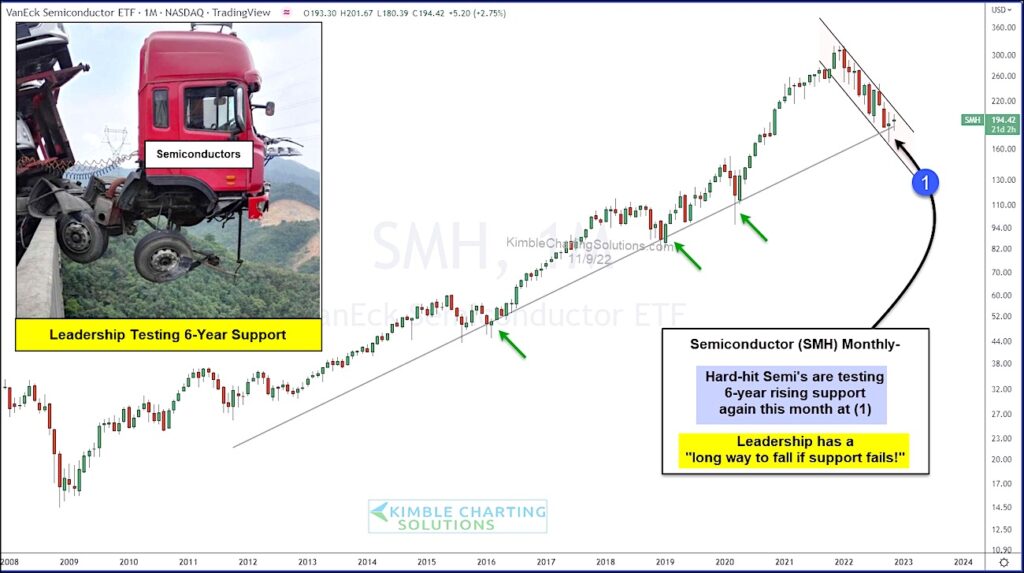
We have spent countless time on research highlighting the turn lower in the tech leading Semiconductors.
It’s been nearly a year and the Semiconductors Sector (SMH) has endured quite a fall.
Can bulls swoop in and save the Semis? If so, it needs to happen soon!
Today, we look at the long-term “monthly” chart of the Semiconductors ETF $SMH. And, as you can see, it’s been a rough go the past 12 months with the Semis losing nearly a third of its value!
More important, though, is that $SMH is testing 6-year rising support at (1). In fact, it’s spent parts of the last two months poking around this all-important support trend line.
In my humble opinion, it is critical for leadership to hang on to support here, as the next support level is a long way down. Stay tuned!
$SMH Semiconductors ETF “monthly” Chart
Note that KimbleCharting is offering a 2 week Free trial to See It Market readers. Just send me an email to services@kimblechartingsolutions.com for details to get set up.
Twitter: @KimbleCharting
Any opinions expressed herein are solely those of the author, and do not in any way represent the views or opinions of any other person or entity.


