The semiconductors sector has always been a great read for the pulse of the technology economy (and Nasdaq Composite).
Tech investors often look to the Semiconductors for leadership… and when they are leading (or breaking out), it’s a good thing. And because technology is a major part of our economy, ALL investors should be paying attention to Semiconductors.
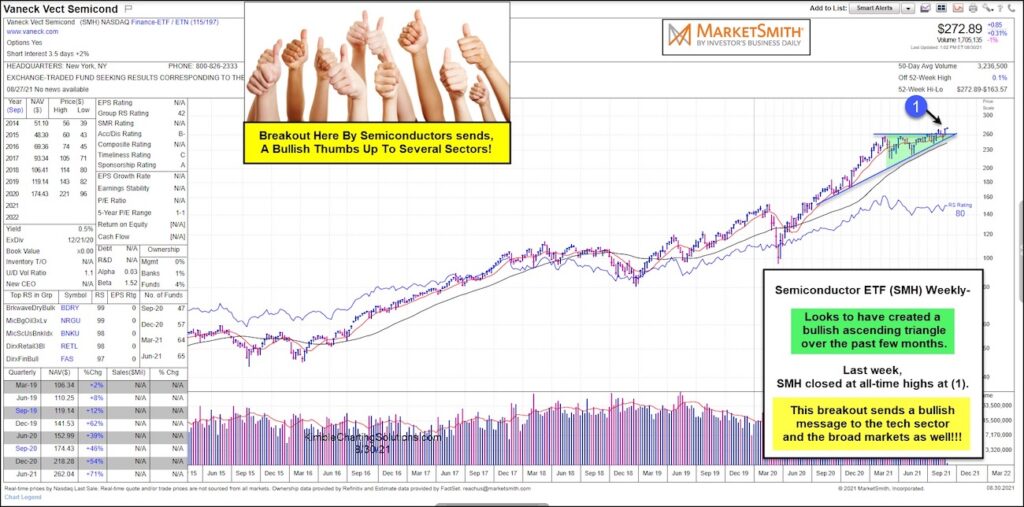
Today’s chart is a long-term “weekly” chart of the popular Semiconductors ETF $SMH.
As you can see, $SMH appears to have created a bullish ascending triangle over the past few months. And, last week, this etf closed at all-time highs (1).
This breakout sends a bullish message to the tech sector and the broad markets as well! Now we just need to see follow through buying and it will be 2 bullish thumbs up for investors! Stay tuned!
$SMH Semiconductors “weekly” Chart
Note that KimbleCharting is offering a 2 week Free trial to See It Market readers. Just send me an email to services@kimblechartingsolutions.com for details to get set up.
Twitter: @KimbleCharting
Any opinions expressed herein are solely those of the author, and do not in any way represent the views or opinions of any other person or entity.
")


")
