After making all time highs in the year 2000, it took the Semiconductor ETF (SMH) 18 years to revisit those highs.
That’s a long lay off!
The Semiconductors are a bellwether in the tech sector as well as a leader within the broader stock market.
The current rally off the December 2018 low has been lead by tech stocks, and has the Semiconductor ETF approaching another important crossroads.
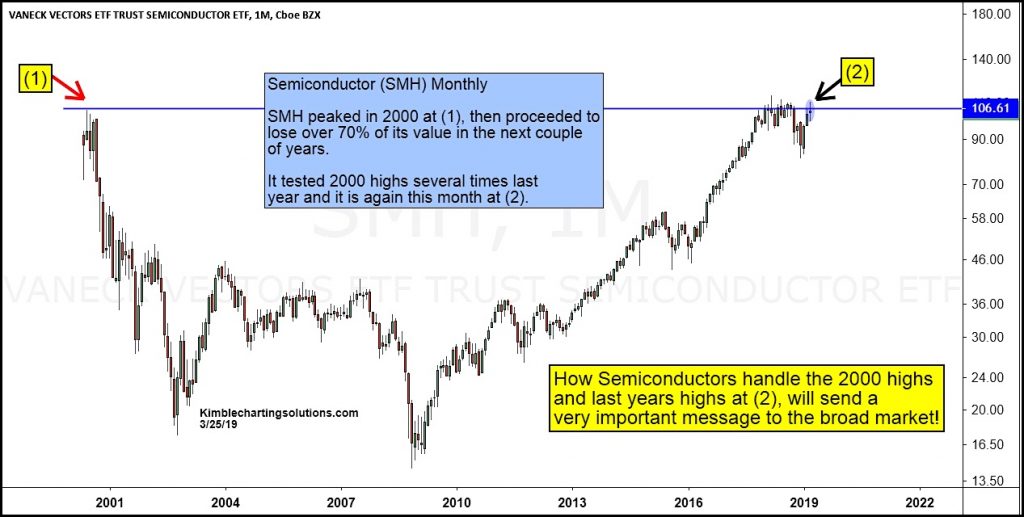
Looking at today’s chart, we can see that the Semiconductors are testing their 2000 highs (1) AND 2018 highs again this month (2).
What they do at (2) should send a very important message to the broad markets! Stay tuned!
Semiconductors ETF (SMH) “monthly” Chart
Note that KimbleCharting is offering a 2 week Free trial to See It Market readers. Just send me an email to services@kimblechartingsolutions.com for details to get set up.
Twitter: @KimbleCharting
Any opinions expressed herein are solely those of the author, and do not in any way represent the views or opinions of any other person or entity.


