After years of underperformance, the Semiconductors Sector (SMH) turned the tables in 2016, becoming a market leader.
And today, the Semiconductors are looking to further cement that leadership role.
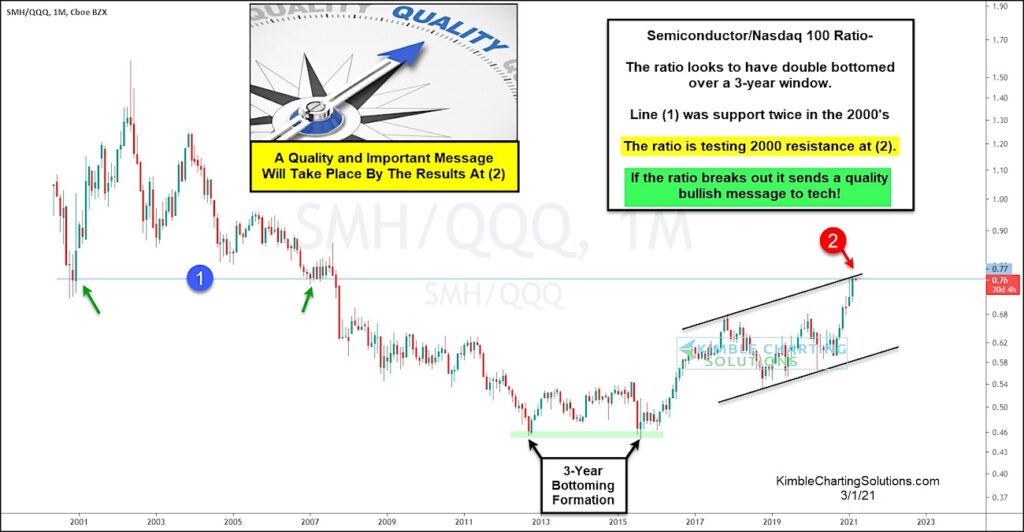
Today’s long-term “monthly” chart highlights the ratio of Semiconductors Sector (SMH) to Nasdaq 100 (QQQ), showing how the Semis have taken the lead in the past 5 years… as well as an important breakout test going on today!
Line (1) was support twice in the 2000s. When that failed, it lead to multi-year underperformance for the Semiconductors. But a double bottom over a 3-year window (2012 – 2015) lead to renewed leadership for the Semis.
The ratio is currently testing the upper end of its rising price channel as well as the resistance line from the 2000s at (2).
If the ratio breaks out above (2), it will send a quality bullish message to Semiconductor bulls. Stay tuned!
SMH / QQQ Semiconductors Performance Ratio vs Nasdaq 100 ETF Chart
Note that KimbleCharting is offering a 2 week Free trial to See It Market readers. Just send me an email to services@kimblechartingsolutions.com for details to get set up.
Twitter: @KimbleCharting
Any opinions expressed herein are solely those of the author, and do not in any way represent the views or opinions of any other person or entity.


: Showing Some Signs of Emerging Strength")
