Since the 2009 stock market lows, investors have looked to the Semiconductor sector for strong returns and market leadership.
Just check out the performance numbers vs the broader stock market: Semiconductor ETF (SMH) +494% vs S&P 500 +262%.
With numbers that double those of the S&P 500, it’s fair to say that the Semiconductors have provided important leadership for this bull market.
And that leadership has become much more apparent (and “visual”) in the past 18-24 months. Just look at that rally and outperformance! See chart below.
Semiconductors (SMH) vs Broader Market (SPX) Performance Chart
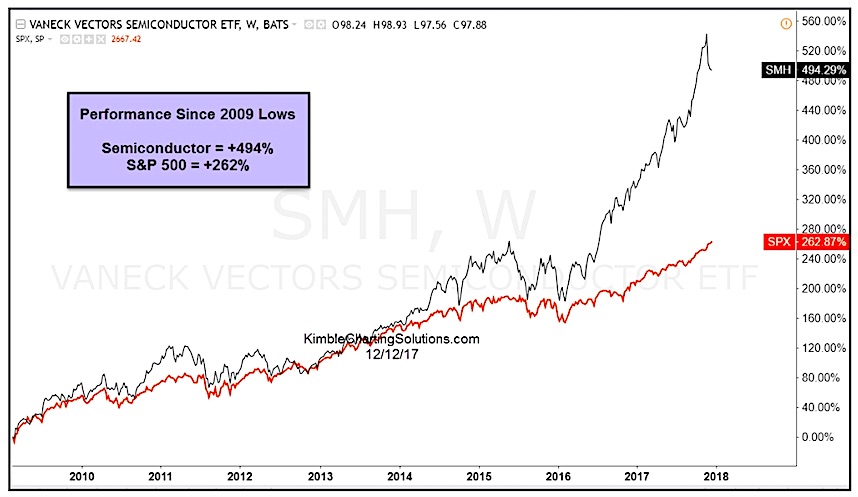
If you look closely at the chart above, you’ll note the recent downturn / pullback for SMH. That brings us to the importance of our next chart – a “monthly” bar chart that highlights why the Semiconductors have pulled back here.
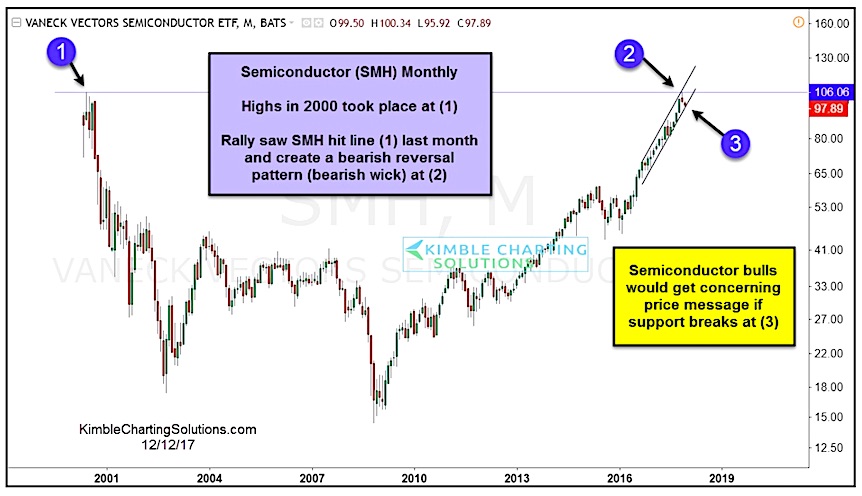
Semiconductors Testing 2000 Highs
The Semiconductor ETF (SMH) recently tested its 2000 price highs (see points 1 & 2 on the chart below), before reversing lower to test uptrend price support (point 3). This action created a bearish reversal pattern and gave market bulls a strong reason to put SMH on their radar.
One thing is for sure: Bullish investors don’t want to see this market leader break down!
$SMH “Monthly” Bar Chart
Get more chart insights and learn more about the “power of the pattern” over at Kimble Charting. Thanks for reading.
Twitter: @KimbleCharting
Any opinions expressed herein are solely those of the author, and do not in any way represent the views or opinions of any other person or entity.


 and Semiconductors (SMH): Concerning Price Pattern?")


