I’ve often told investors you should have three goals: identify trends, follow those trends, and anticipate when those trends are exhausted. So how does that relate to sector rotation?
Quite simply, it represents the cyclical nature of the financial markets, as sectors and themes and styles come in and out of favor.
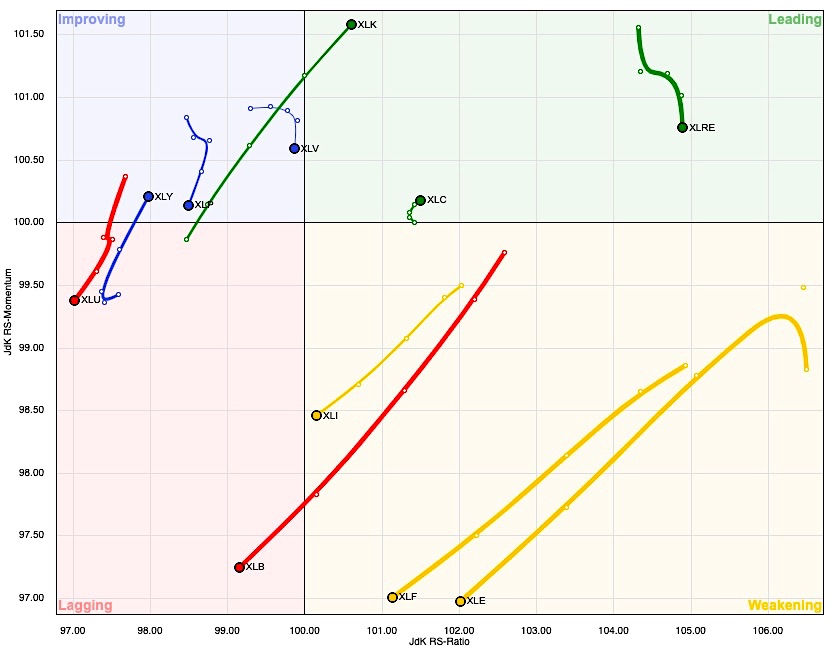
In today’s video, we’ll use the Relative Rotation Graphs (RRG) to visualize how the eleven S&P 500 sectors are rotating through periods of strength and weakness. We’ll also discuss how to identify opportunities for outperformance and highlight three particular sectors: Technology, Industrials, and Real Estate.
Here are a few questions about sector rotation that we address in today’s video:
– How can we define the rotation away from cyclical sectors over the last 6-8 weeks?
– Why are growth-oriented sectors well-positioned given recent relative strength?
– Which sector led the markets in the bull phase of 2014, and is also strong today?
For deeper dives into market awareness, investor psychology and routines, check out my YouTube channel!
[VIDEO] One Chart: Sector Rotation
RRG Sector Rotation Chart
Twitter: @DKellerCMT
The author may have positions in mentioned securities at the time of publication. Any opinions expressed herein are solely those of the author, and do not in any way represent the views or opinions of any other person or entity.


