Ok, we are not fans of seasonal trends in the market for one simple reason: it is never that simple!
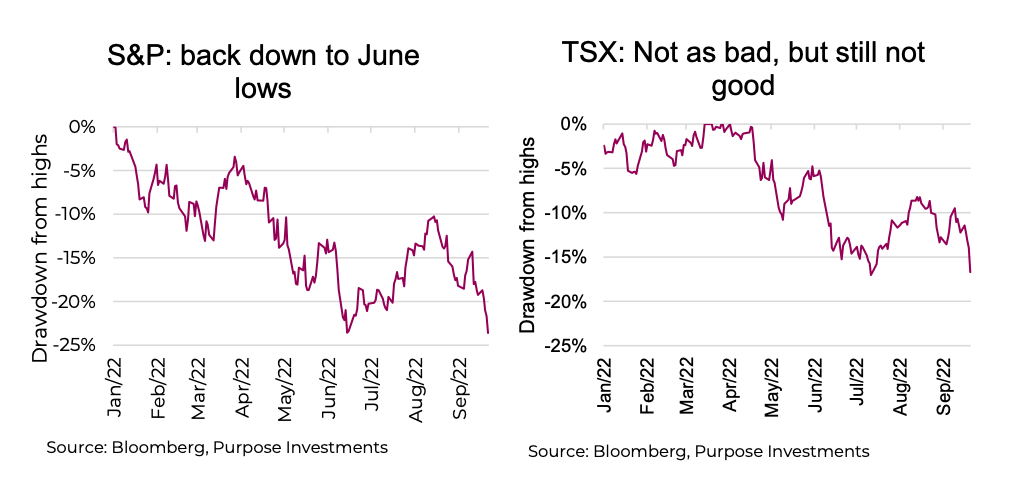
Nonetheless, September, which has a history of lower returns and higher volatility, is certainly giving the seasonal supporters strong evidence this year. The S&P 500 has been as high as 4,119 and as low as 3,688 – let’s call it a 10% variance.
And the month is not over. The TSX and many other markets are showing similar patterns. Last year was a great year for investors and 2022 is turning into the exact opposite, with both equity and bonds losing substantial value.
The root causes are well known and widely discussed. Rising inflation and central bank responses were the original driver of lower asset prices for equities, bonds and even real estate. This is now being complemented by recession fears and the implications for earnings, which in many cases remain optimistically high. You have to look hard to find a feel-good narrative. We read a lot of macro-outlooks from internal sources and many from research shops in North America and beyond, and the vast majority have a rather pessimistic view of what lies ahead.
What will put in a floor for this market? In most bear market cases, it is many months or even a few quarters before economic activity bottoms and many months before earnings growth troughs. So, a risk of recession ahead isn’t good news, but the market is already pricing in some of that risk. The fact is most bear markets put in a bottom when the root cause begins to improve. In this case, it is inflation. Not saying it must disappear, but if it shows a few months of improvement that may be enough to kick start a market recovery. After all, if you wait for the ‘all clear’ you will likely have missed a lot.
Inflation has not shown signs of improvement, as is evident in the most recent U.S. CPI print. It’s worth noting Canada has seen an early sign of improvement, but it is the U.S. data that matters most. The next U.S. CPI release is October 13, a few weeks out. In the meantime, there are some survey data on inflation expectations that may provide some insight. Still, we probably have to wait for improvement on inflation. But make no mistake, improvement in this area could easily kick start a strong rally in both equities and bonds (dare to dream).
Let’s turn to valuations –Valuations can provide a decent signal during bear markets. No, they don’t ever mark a bottom, but as prices fall and valuations improve, the downside risk declines as upside potential rises. If you buy something at $8 instead of $10, your expected return has improved (it could still be negative, just less negative compared to the $10 entry).
Valuations have improved even for the more expensive S&P 500. There are solid reasons the U.S. market should trade at a premium. Historically it has; the breadth of companies is very enviable relative to most other major market indices. The U.S. does benefit from energy and food security. But is it cheap? Not really.
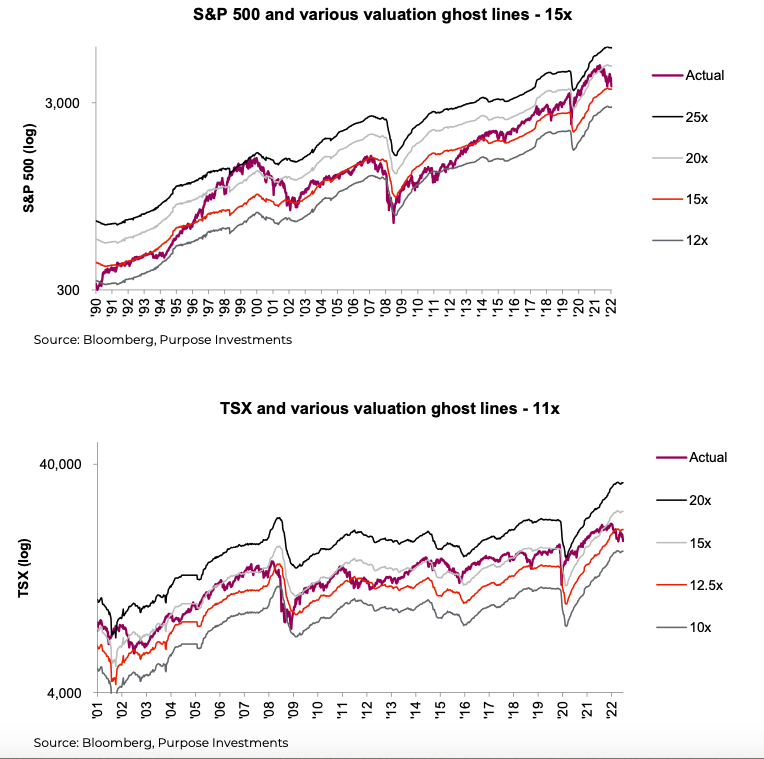
The two charts above show the S&P 500 and TSX including valuation ghost lines. These finer lines indicate where the index would be trading at various multiples. The S&P 500 has seen its multiple fall, approaching 15x. Not cheap but certainly better value than years past. There should be some multiple compression given higher yields, but the big question is whether this is enough. We would also point out that forecast earnings growth at 15% over the next year still appears on the overly optimistic side.
Canada on the other hand is now trading down to 11x earnings. Yes, a bigger chunk of those earnings are from much more cyclical sectors such as energy and materials, but the TSX is certainly pricing in a more muted outlook. Earnings growth priced in for the next 12-months is 10%, also more reasonable. International markets are also nearing the cheap end of the spectrum.
In our view, this does provide a better margin of safety for Canada and international markets relative to the U.S. That doesn’t mean markets are about to bottom, just that medium return expectations from these valuation levels are tilted to the upside of normal.
And now sentiment – During market extremes, sentiment tends to trump valuations, fundamentals, economics and often common sense. There is no denying markets are oversold, and no denying sentiment is near extreme bearishness (which is bullish).
Take your pick:
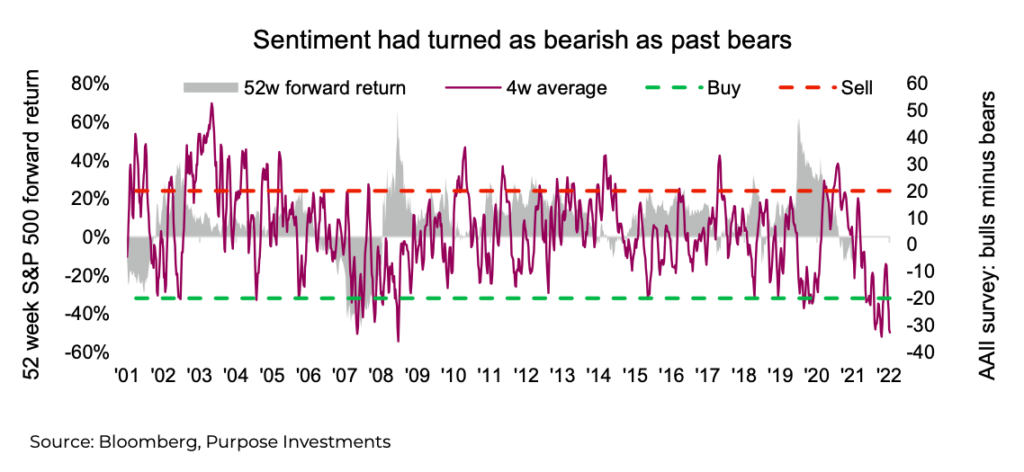
The AAII investor survey is showing the most bearish 61% since the 70% reading on March 5 of 2009 (note the S&P bottomed March 6, 2009). The chart above is the four-week average bulls minus the bears,
which currently sits at -32. Readings at these levels tend to imply a strong market advance during the subsequent 12-months. However, during 2008 there were many bearish signals before the market ever bottomed. This just goes to show that things work most of the time, but not all the time.
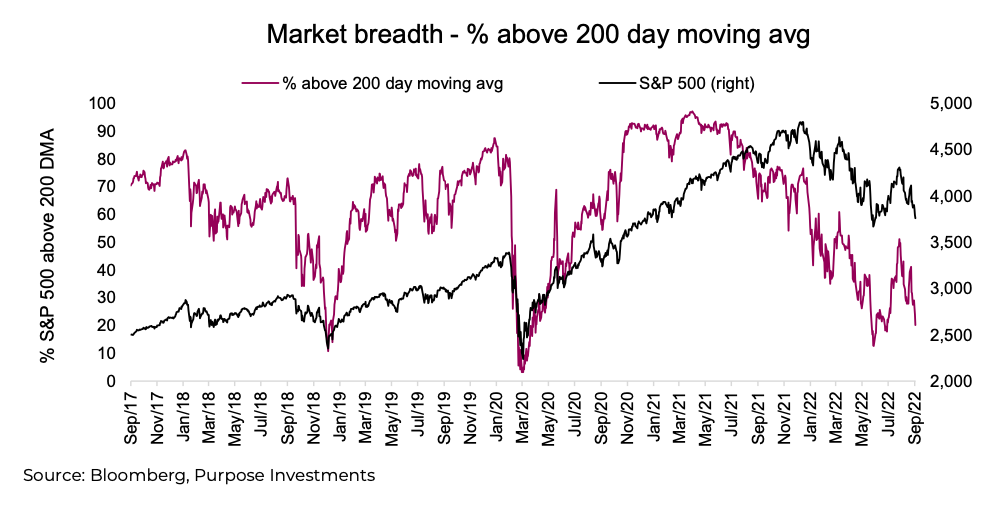
Market breadth is also flashing buy signals as seen in the chart above. The percentage of S&P 500 companies trading below their respective 200-day moving averages is 20% which will go even lower by the close on Friday, September 23 as the S&P is down more than 2%. Of course, breadth can go lower, and it was slightly lower in mid-June before the S&P rallied over 15%. Still, this is an extremely bearish reading, which is bullish.
Impact on portfolios
Our fall strategy remains intact. We decreased U.S. equity in mid-August as we believed it was a temporary bear market rally, and increased cash. Our expectation is for inflation to begin to fade sometime soon as recession talk grows louder, at which point we expect to deploy some of the raised cash. We believe a rally could result from inflation rolling over. The current sentiment readings are encouraging, as just about everyone is bearish, but we have not planned any significant moves as of yet.
Note: Our path remains data-dependent and may vary; we will advise of any portfolio changes.
Source: Charts are sourced to Bloomberg L.P., Purpose Investments Inc., and Richardson Wealth unless otherwise noted.
Twitter: @ConnectedWealth
Any opinions expressed herein are solely those of the authors, and do not in any way represent the views or opinions of any other person or entity.


