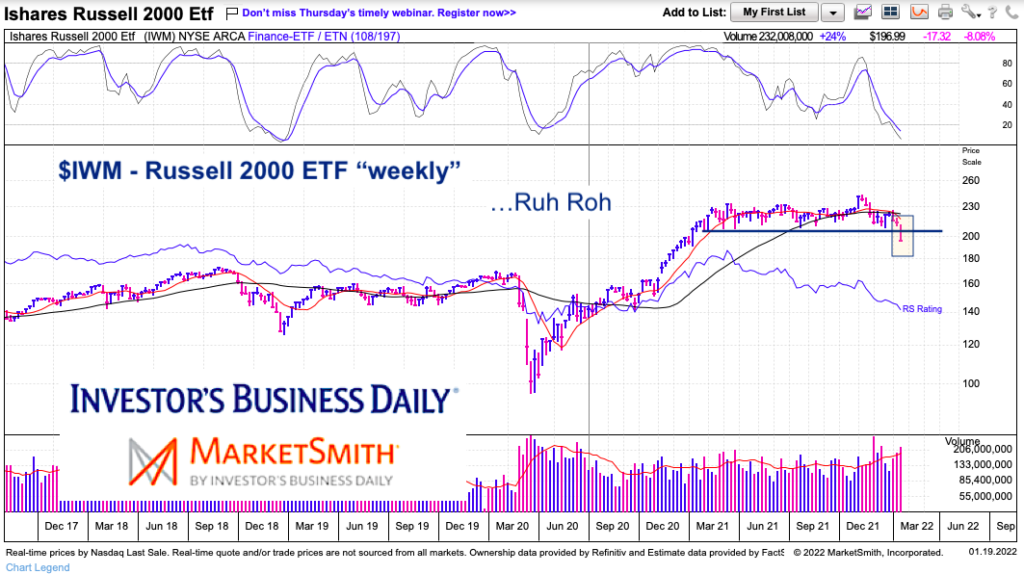
The Russell 2000 breached lateral support this week as a bear market descended upon small cap stocks..
Just behind small caps are tech stocks, as those two areas are seeing heavy selling. This aligns with the concept that high beta / growth stocks rise and fall the most during sharp rallies / selloffs.
This also feeds into the idea that growth stocks will cede ground to value stocks in a possible change of trend this year. We’ll see.
Today we highlight the decline of the Russell 2000.
Note that the following MarketSmith charts are built with Investors Business Daily’s product suite.
I am an Investors Business Daily (IBD) partner and promote the use of their products. The entire platform offers a good mix of analysts, education, and technical and fundamental data.
$IWM Russell 2000 “weekly” Chart
Here we can see the breakdown to new 52 week lows. Although this looks important, it may be more symbolic. Remember IWM broke out to new highs before beginning its current decent to new lows. So perhaps it’s just a reminder that we are in a market correction.
Small caps appear to be nearing oversold levels here so a bounce wouldn’t be surprising. That said, if/when selling resumes, the $165-$170 level looks important (prior breakout area).
Twitter: @andrewnyquist
The author may have a position in mentioned securities at the time of publication. Any opinions expressed herein are solely those of the author, and do not in any way represent the views or opinions of any other person or entity.


