It’s been a nice comeback story for the stock market.
Early in the year, stocks were down and uncertainty high. But from there the ‘wall of worry’ was built and climbed.
And the S&P 500 and Nasdaq climbed back to new highs. The small cap Russell 2000 not so much.
The Russell 2000 has been the laggard and is still well off last year’s high. And it’s approaching an important price resistance level.
Note that the following MarketSurge charts are built with Investors Business Daily’s product suite.
I am an Investors Business Daily (IBD) partner and promote the use of their products. The entire platform offers a good mix of tools, education, and technical and fundamental data.
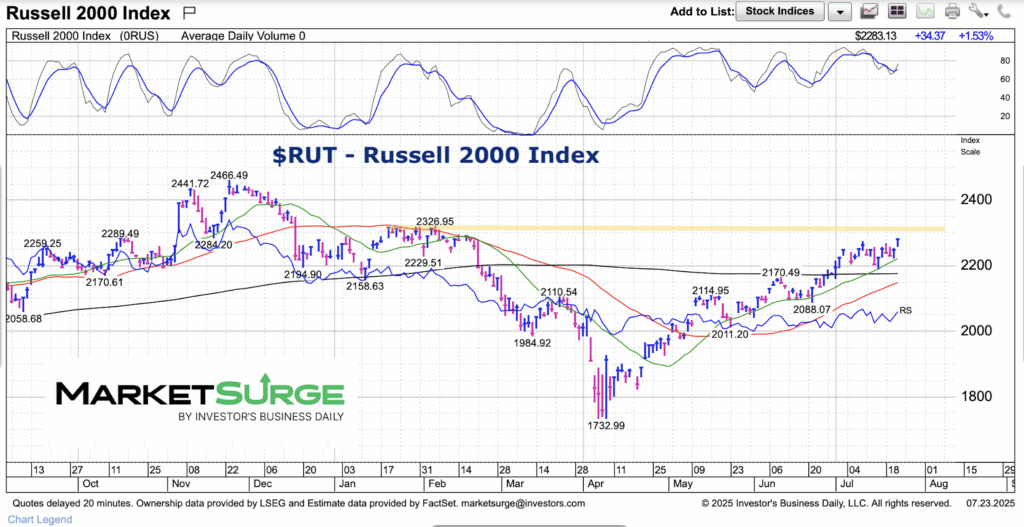
$RUT Russell 2000 Index Chart
As you can see, small caps are still trending higher while looking up at resistance. The orange line marks important resistance to the Russell 2000’s path to new highs. If it can breakout above 2325, it has a chance at testing 2466 (last November’s high).
Twitter: @andrewnyquist
The author may have a position in mentioned securities at the time of publication. Any opinions expressed herein are solely those of the author, and do not in any way represent the views or opinions of any other person or entity.


")