The Russell 2000 Index has been trading in a sideways, top-like pattern for the past several weeks.
We recently pointed this out while sharing our thoughts on the potential for a price reversal to the downside.
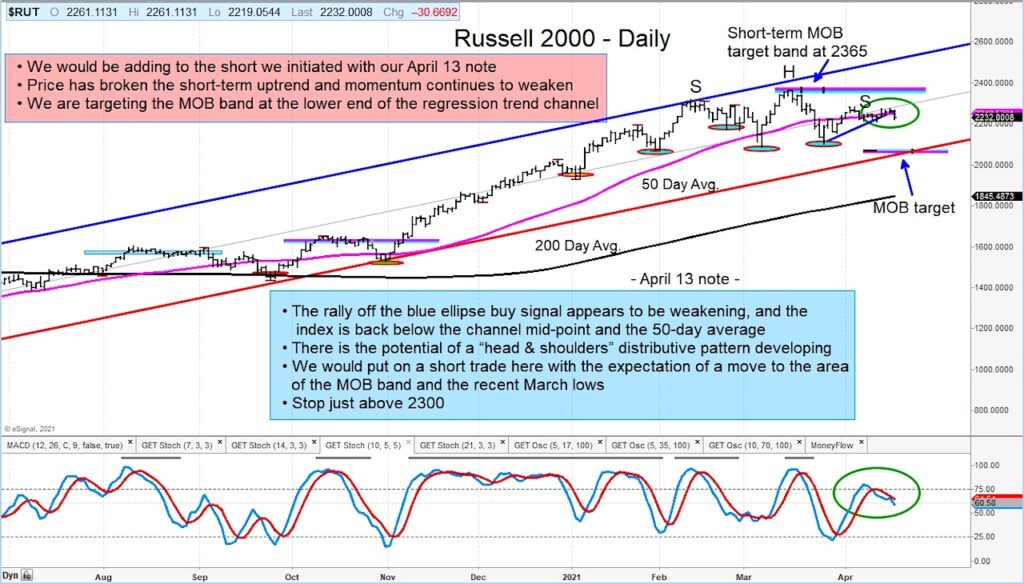
Today, I share an updated chart of the Russell 2000 Index.
Regardless of whether or not the Head and Shoulders pattern is too obvious, the price action has been top-like and is producing overhead supply that could thwart any near-term breakout attempts. Just like rounded bottoms are great for a bullish trade, rounded tops are a warning that a decline may be in the offing. This setup is worth watching. Small caps could be an early canary…
The Russell 2000 is weakening and may be in line for a re-test of February / March lows. In any event, this is worth watching.
Russell 2000 Index Chart – Price Analysis
The author or his firm may have a position in mentioned securities at the time of publication. Any opinions expressed herein are solely those of the author, and do not in any way represent the views or opinions of any other person or entity.

 Testing Important Price Support")
: Cup (and Maybe Handle) Watch")

