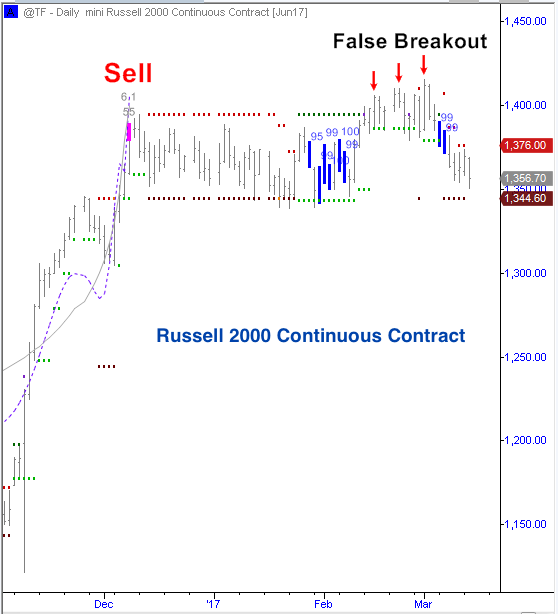
Timing the market isn’t always easy. That’s why at Market Inflections we use sophisticated Market Timing Software to try to determine when trends are about to begin and end. In December 2016, this software generated a top signal on the Russell 2000 Futures Contract (pink bar in the chart below) suggesting that the post-election rally was coming to an end.
Since that time, the Russell 2000 (INDEXRUSSELL:RUT) has traded within a tight 50-point range.
In late January and early February, it triggered a series of signals suggesting a new trend was about to begin (blue bars in the chart below). In late February, the Russell 2000 broke out to new highs – however, the breakout was short-lived. Last week new signals formed again suggesting that a new trend was about to begin and the Russell 2000 immediately started to sell off.
This is a clear example of a false breakout. When false breakouts like this occur, the first move is typically the wrong move – and a much powerful trend in the opposite direction unfolds. A daily close below 1344 would confirm this analysis and suggest that a new persistent downtrend is about to begin which should last through late April or early May.
Russell 2000 Chart – Topping Signal
In my opinion, there are a number of ways that traders can initiate positions based on these signals:
- The most reliable strategy to trade these compression signals (the blue bars indicating that a new trend is about to begin) is with an options strategy using straddles or strangles. In this case, we would suggest looking at an equal number of April or May IWM 136 puts and 136 calls for a straddle strategy or 135 puts and 137 calls for a strangle strategy. In this trade, the direction of the new trend does not matter – so long as a persistent trend emerges, this trade will make money. The only way this trade loses money is if IWM remains rangebound for the next few months.
- Another options strategy one might employ is more directional: betting on the false breakout. Such a strategy would entail buying April or May IWM Puts (slightly out of the money), or conversely selling an April or May IWM Call Spread (again, slightly out of the money). The stop on this trade should be if IWM trades above 141. An aggressive trader might consider this strategy immediately, while a more conservative trader would wait for IWM to close a day below 134 to confirm the false breakout setup.
- A strategy to utilize ETFs instead of options would involve either shorting the IWM ETF or buying the RWM ETF (this is an inverse ETF for the Russell 2000). The stop on this trade should be if IWM trades above 141. Again, an aggressive trader might consider this strategy immediately, while a more conservative trader would wait for IWM to close a day below 134 to confirm the false breakout setup.
- Futures traders should consider shorting the June Russell 2000 Futures Contract with a stop at 1414. An aggressive trader might consider this strategy immediately, while a more conservative trader would wait for the Russell 2000 Futures Contract to close a day below 1344 to confirm the false breakout setup.
If you find this information useful, please consider signing up for our free webinar on Thursday March 16th at 5:00PM EST during which we will announce the launch of a new exciting service to deliver signals such as these to your inbox. You can also get more information about our work by checking out our website. Thanks for reading.
Twitter: @larryfooter
Any opinions expressed herein are solely those of the author, and do not in any way represent the views or opinions of any other person or entity.


: Showing Some Signs of Emerging Strength")
