After months of strong bullish action for the small cap stock index, the Russell 2000, chart patterns have turned indecisive.
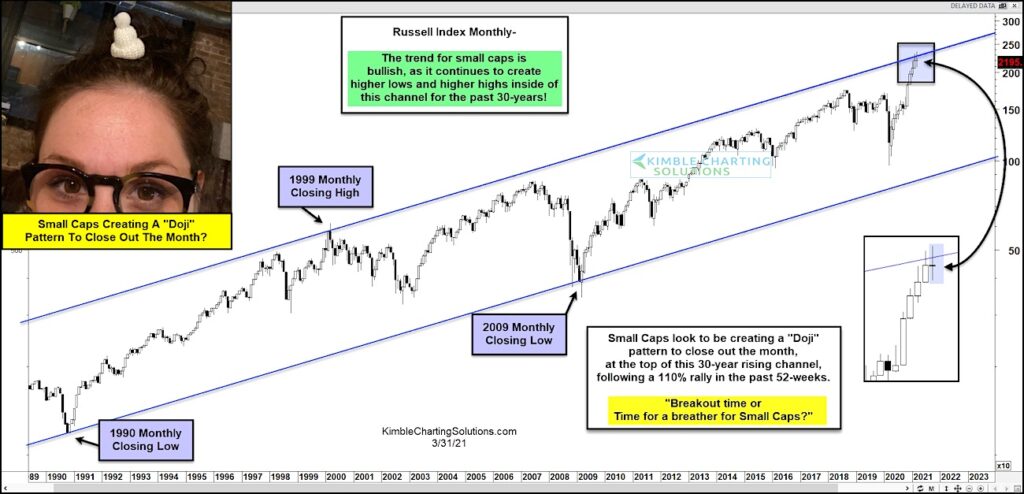
The broader trend is still bullish (higher highs and higher lows), but the month of March produced a Doji pattern. And this comes after a 110% rally!
As well, the Russell 2000 is testing the topside of a 30-Year price channel.
Doji patterns are a sign of indecision… so nothing is decided yet. But it might be worth keeping a close eye as we head into Spring.
Small caps are a “risk-on” indicator, so any stalling out could be a warning to the broader market. Stay tuned!
Russell 2000 “monthly” Chart
Note that KimbleCharting is offering a 2 week Free trial to See It Market readers. Just send me an email to services@kimblechartingsolutions.com for details to get set up.
Twitter: @KimbleCharting
Any opinions expressed herein are solely those of the author, and do not in any way represent the views or opinions of any other person or entity.


