The Russell 2000 Index (INDEXRUSSELL:RUT) is still well off its 52 week highs. The underperformance has been due to investors preference for lower risk, high quality blue chip stocks (over the past 2 years). Needless to say, the Russell 2000 Index is a very important gauge/indicator of market behavior.
Right now, the Russell 2000 is rallying into price resistance. It’s important resistance in that the level is formed from of a very bullish Russell 2000 chart pattern: the inverse head and shoulders pattern.
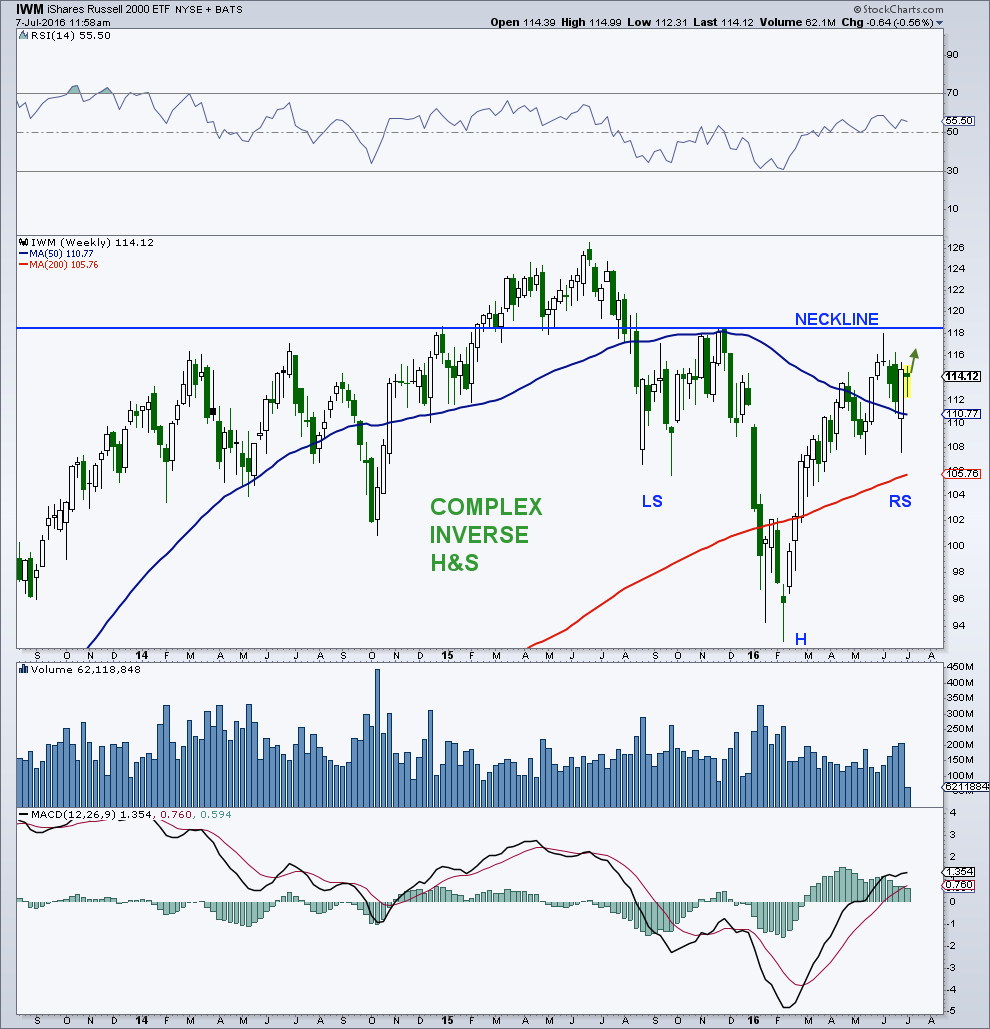
As you can see in the weekly chart below (through Thursday), the Russell 2000 ETF (NYSEARCA:IWM) is working on a bullish, complex, inverse head-and-shoulders pattern. Price needs a strong break above 118.54 to complete (and confirm) the formation. The weekly momentum indicator is bullish. Note that if the Russell 2000 does breakout, it would target 140’s based on the size of the base.
With today’s burst higher, the Russell 2000 ETF (IWM) is now nearing $117 and testing this neckline. Next week should be important.
A bullish confirmation of the head and shoulders pattern (i.e. breakout above the neckline) would have broad implications for the stock market. It would likely coincide with a breakout of the S&P 500 Index to new highs (thus confirming the next wave higher of this bull market). On the flip side, a failure at the neckline resistance would likely slow the bullish advance.
Thanks for reading and best of luck out there. You can contact me at arbetermark@gmail.com for premium newsletter inquiries.
Twitter: @MarkArbeter
The author may have positions in mentioned securities at the time of publication. Any opinions expressed herein are solely those of the author, and do not in any way represent the views or opinions of any other person or entity.


