Year-to-date, the Russell 2000 (RUT) has lagged the S&P 500 by almost 8%, a fairly wide divergence. This divergence has a few investors concerned that this is a sign of weakness to come in the broad markets. But an interesting technical development highlights an important near-term intersection of time and price.
The chart below takes a technical perspective of how the bulls & bears could be looking at small caps. And perhaps this is why the small caps have endured so much volatility this year!
Russell 2000 Long-Term Chart with Support/Resistance
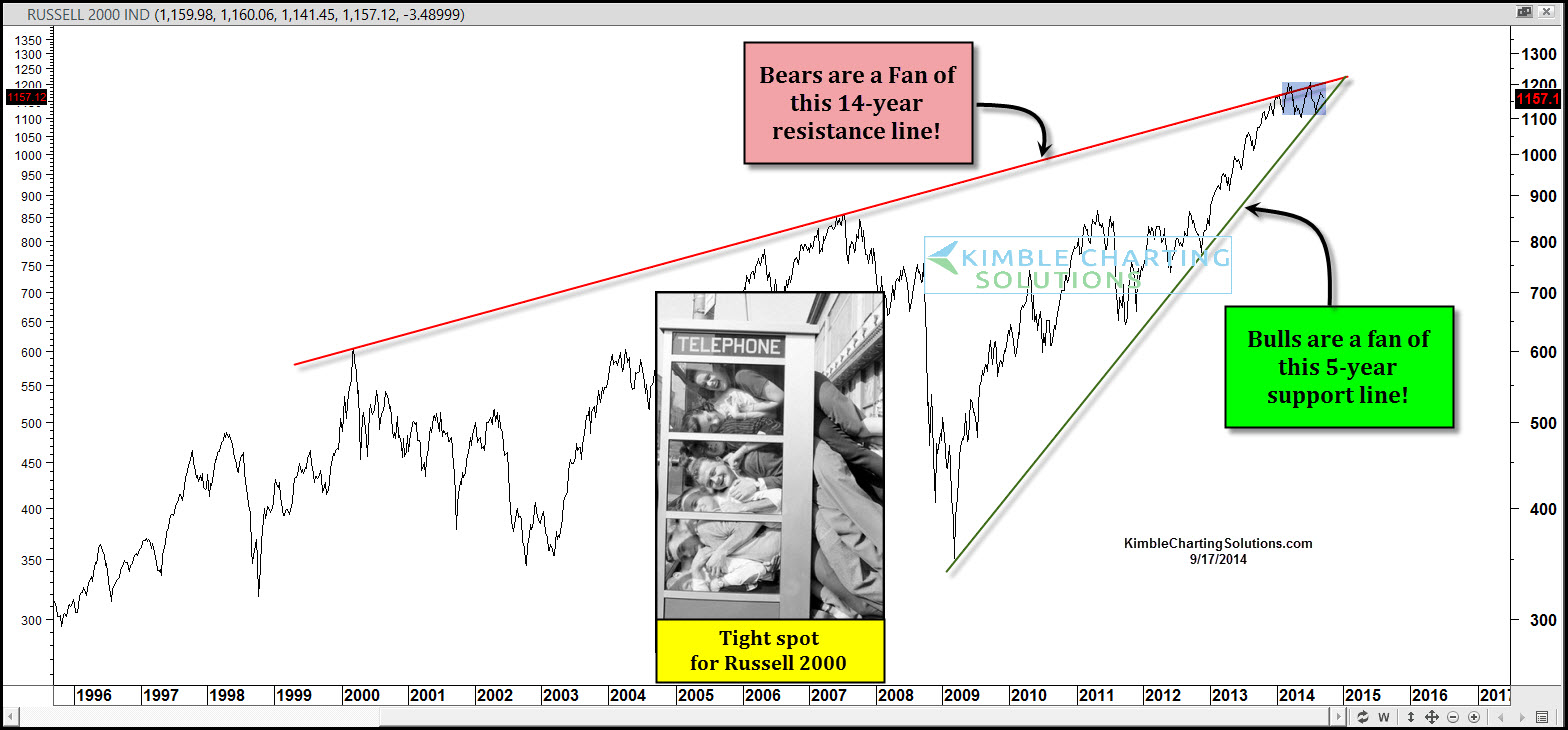
Bears like this: Back in early March the Russell 2000 came upon a 14-year resistance line. Since then the Russell is down 3%, while the S&P is up almost 8%.
Bulls like this: 6 weeks ago small caps hit a rising 5-year support line and have moved higher since, moving in sync with the broad market.
As you can see these two support/resistance lines have seemed to impact small caps over the past few months, as they have mostly chopped back and forth between these lines.
The bottom line here is that the Russell 2000 is in a tight technical jam that looks like it will resolve soon. Whether you are bullish or bearish small caps, an interesting technical intersection awaits the small caps! And it should pay to follow the coming breakout/breakdown. Thanks for reading.
Follow Chris on Twitter: @KimbleCharting
No position in any of the securities mentioned at the time of publication. Any opinions expressed herein are solely those of the author, and do not in any way represent the views or opinions of any other person or entity.

 Testing Important Price Support")
: Cup (and Maybe Handle) Watch")

