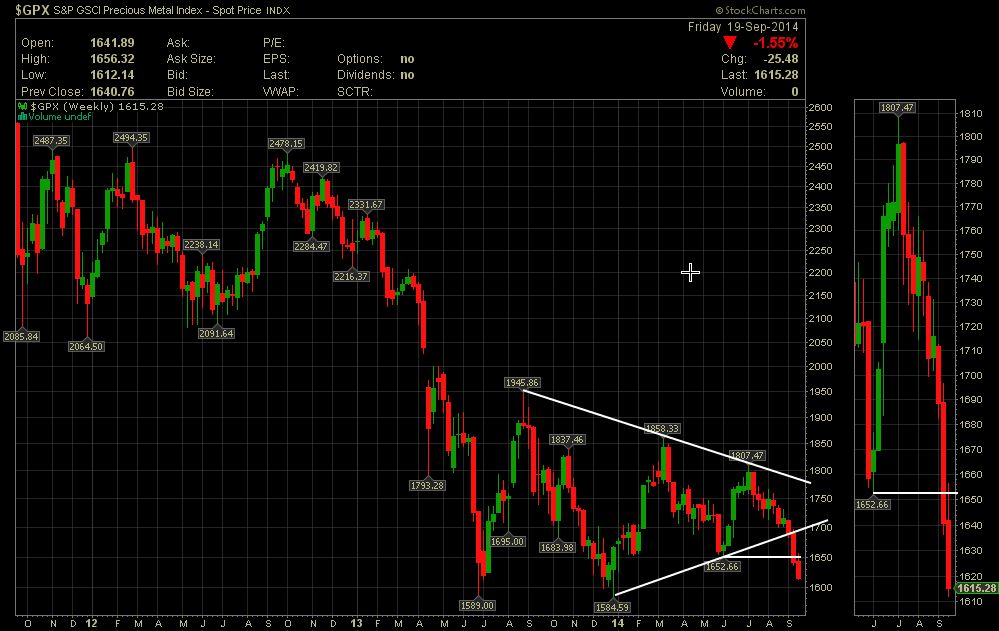
The Goldman Sachs Precious Metals Index (GPX), ended the week down another 1.55 percent at 1615.28. This closing price has decisively broken the weekly support of 1652.66 made in June of 2014. The next major support level to watch now is 1584.59, the weekly low made in December of 2013. I have been highlighting this weakness in precious metals for a while and it seems as if investors are finally beginning to take note of this development now.
Furthermore, should the US Dollar remain strong, there is a chance that the December lows are tested next week. There was notable weakness in both Gold and Silver on Friday and this could carry over to next week, so best to stay on your toes.
Goldman Sachs Precious Metals Index
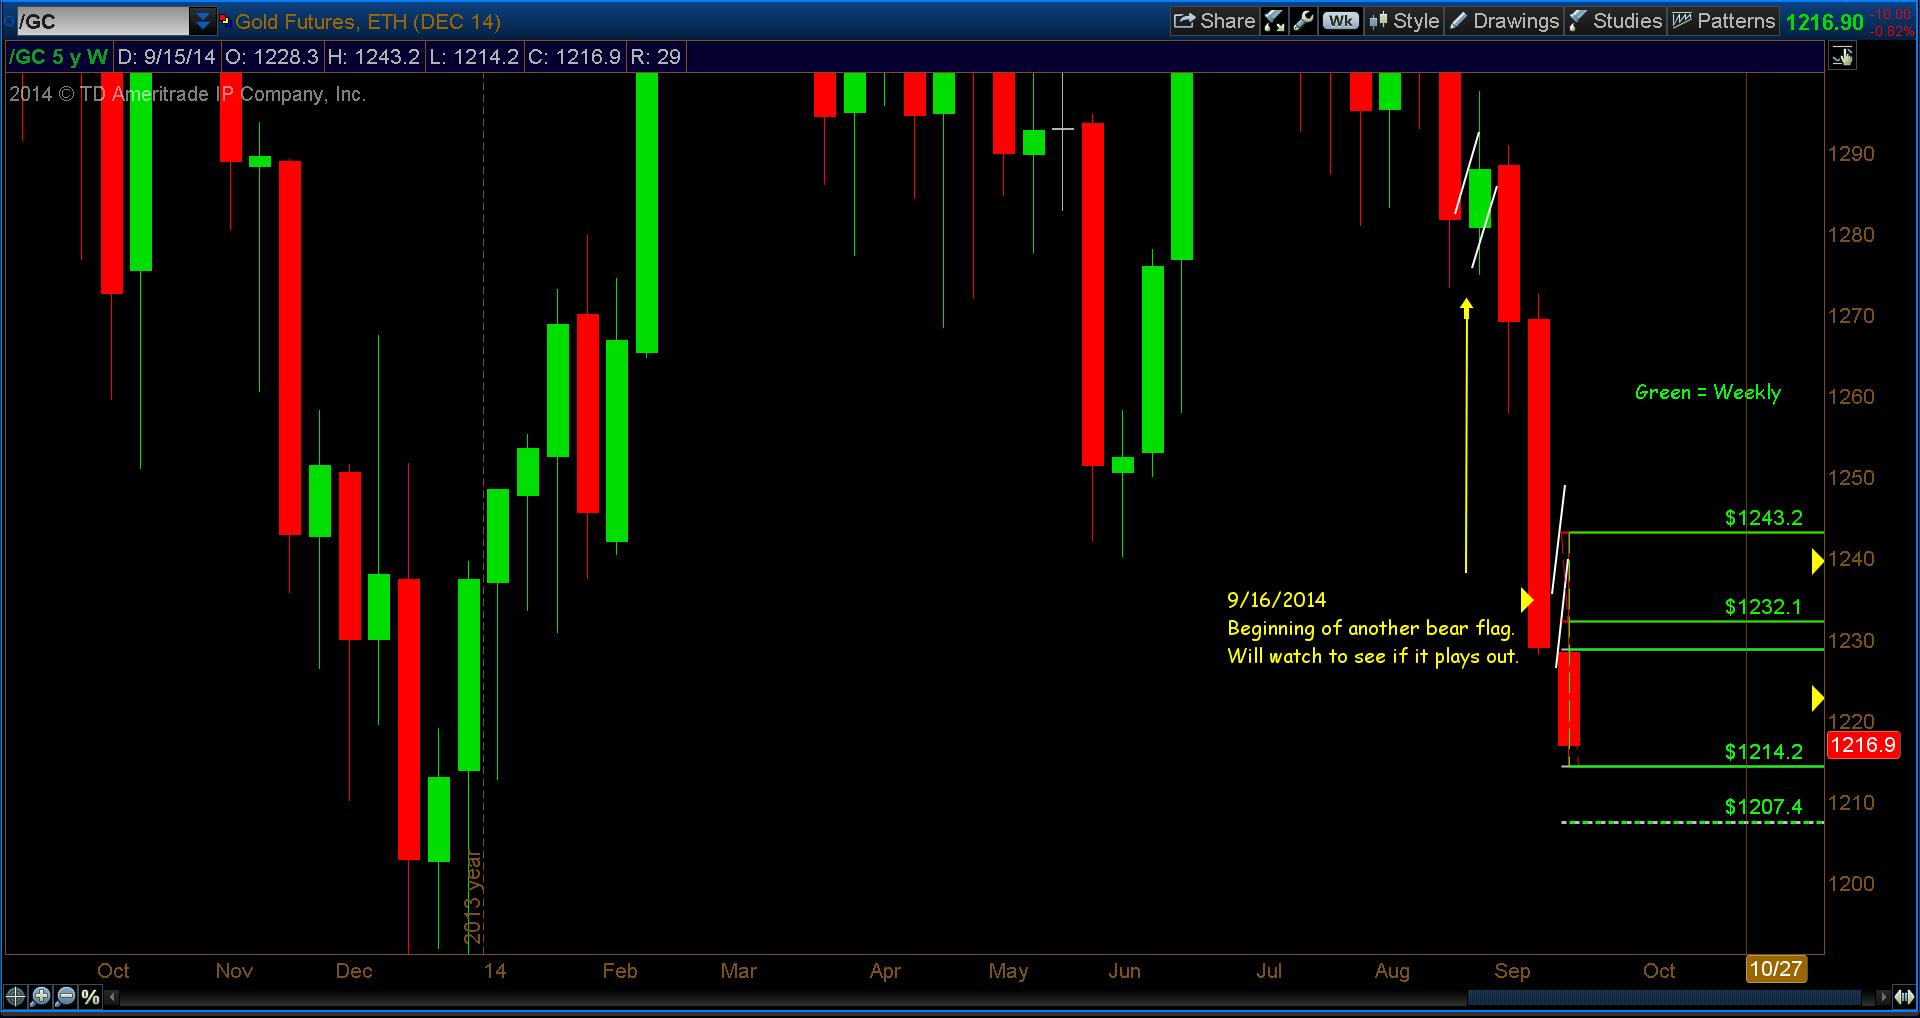
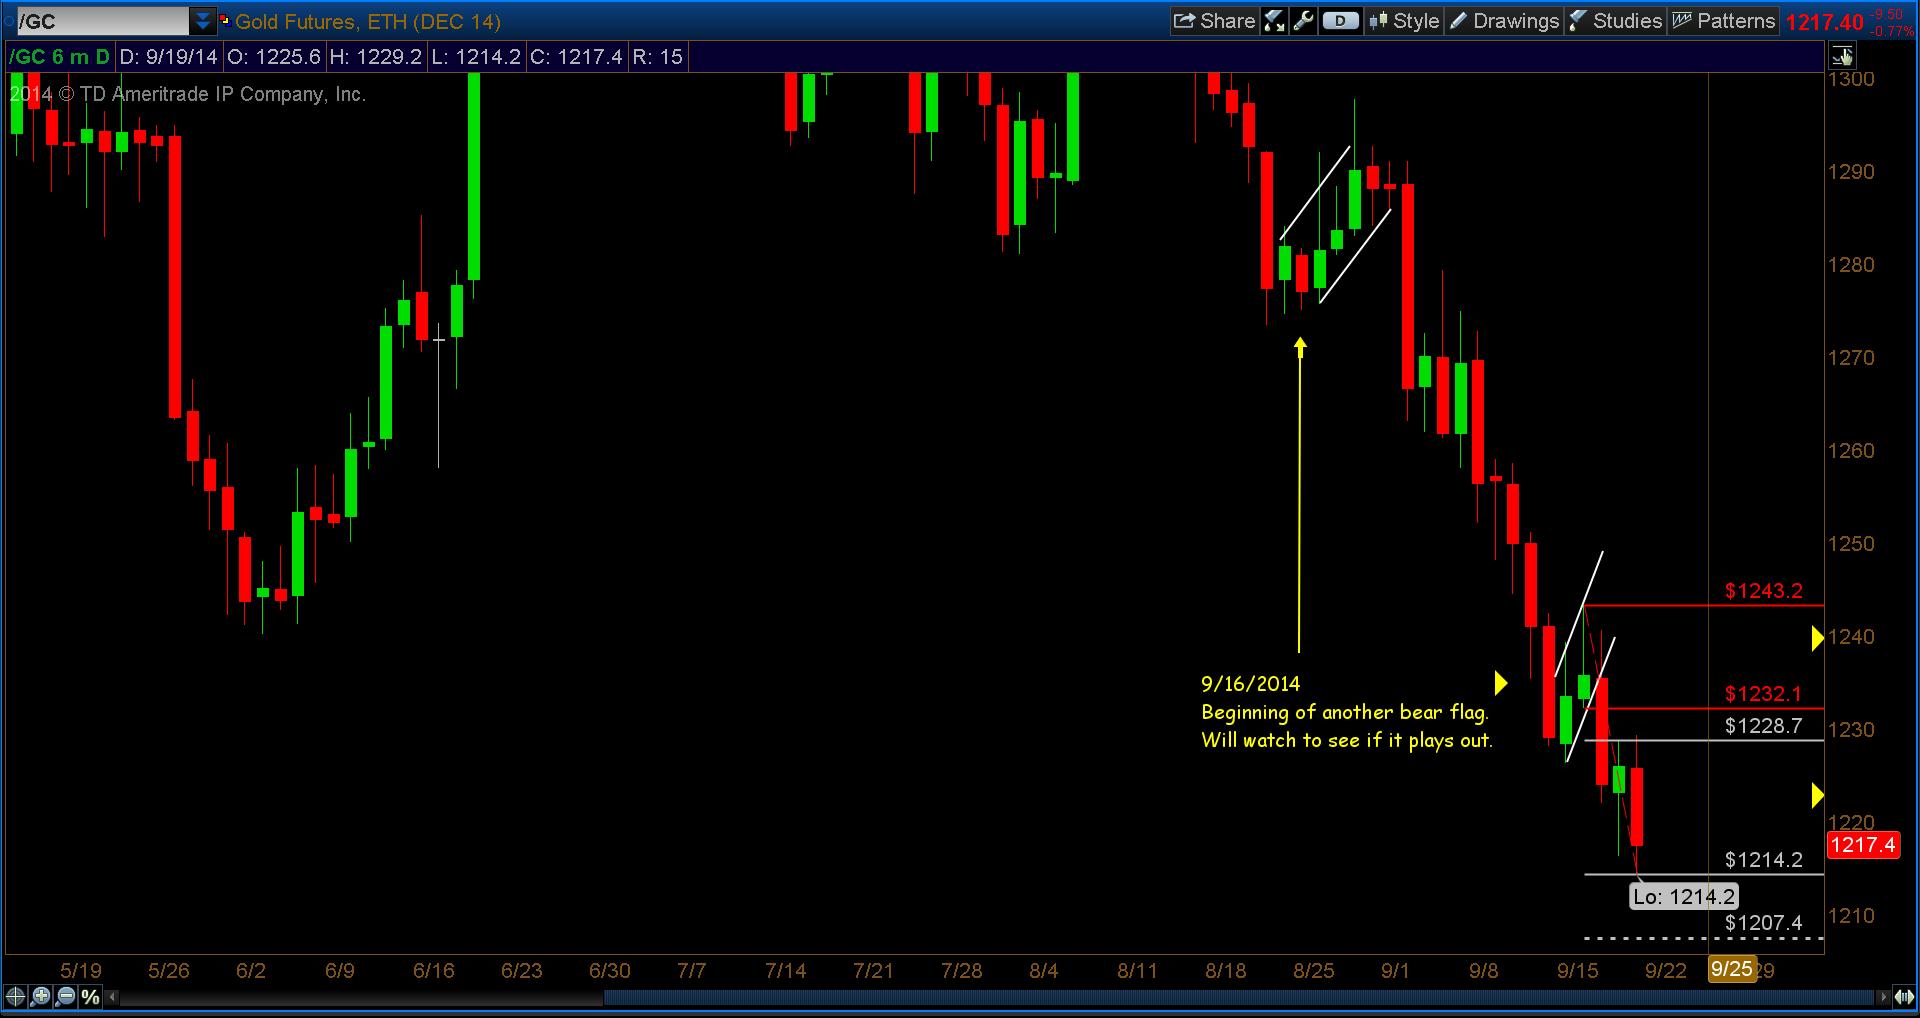
As you can see in the chart below, Gold Futures hit and closed another downside Fibonacci price target of 1217.60 and now has a new downside target of 1207.40. Ironically, 1207.40 is also the new target on the daily chart as well. so that will be a price to watch early next week. Note that equity investors can follow the Gold ETF (GLD) as well.
Gold Weekly Price Chart
Gold Daily Price Chart
No position in any of the mentioned securities at the time of publication. Any opinions expressed herein are solely those of the author, and do not in any way represent the views or opinions of any other person or entity.

 Flirting With Critical Support… Again")


